European shares struggle to bounce back from Asian losses
- US futures point to rebound in the upcoming US session
- US majors yesterday slid into the red territory on mixed trade policy messages
- EM currencies hit lowest level in almost one year, weighed by ongoing dollar strength
Indian rupee hits all-time low; Chinese yuan post longest losing streak in years
- Oil on track for highest close since November 2014
Indonesia monetary policy decision comes out on Thursday.
US personal spending probably increased for the third month in May, economists forecast ahead of Friday's data.
China manufacturing and non-manufacturing PMIs are due on Saturday.
The STOXX Europe 600 slipped 0.1 percent.
Futures on the S&P 500 gained 0.3 percent, the most significant rise in two weeks.
The UK’s FTSE 100 fell 0.2 percent.
Germany’s DAX gained 0.1 percent.
The MSCI Emerging Market Index lost 1.1 percent to the lowest level in more than 11 months.
The MSCI AC Asia Pacific dropped 0.5 percent to the lowest level in almost nine months.
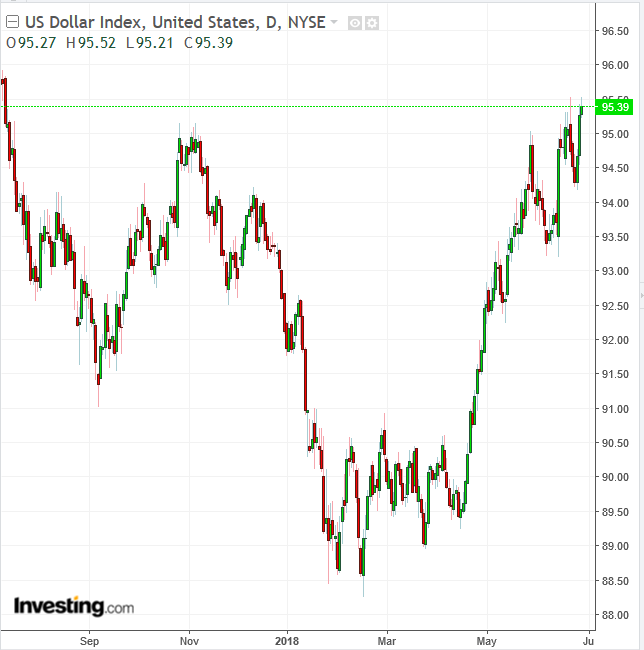
The Dollar Index gained 0.2 percent to the highest level in about a year.
The euro dropped 0.1 percent to $1.1545, the weakest level in a month.
The British pound slid 0.2 percent to $1.3082, the weakest level in about eight months.
The Japanese yen lost 0.1 percent to 110.40 per dollar, the weakest level in more than a week.
The Turkish lira fell 0.1 percent to 4.6275 per dollar.
The yield on 10-year Treasurys climbed one basis point to 2.84 percent, the first advance in more than a week.
Germany’s 10-year yield gained one basis point to 0.33 percent.
Britain’s 10-year yield ticked one basis point higher to 1.251 percent.
Italy’s 10-year yield edged two basis points lower to 2.786 percent.
West Texas Intermediate crude fell 0.4 percent to $72.47 a barrel.
Gold slipped 0.2 percent to $1,249.43 an ounce, the weakest level in more than six months.
Brent crude lost 0.2 percent to $77.45 a barrel.
Key Events
Stocks in Europe seesawed while US futures on the S&P 500, Dow and NASDAQ 100 climbed higher on Thursday, pointing to a shaky rebound from the declines seen across Asian indices in the earlier session.
Emerging market currencies are continuing to be hit by the persistently strengthening dollar, driving overseas investors into other assets. The USD has followed Treasury yields higher.
The STOXX 600 opened 0.4 lower, weighed down by miners and travel companies, giving up the 0.72 percent advance posted yesterday. The European benchmark index then started to tick higher, moving towards Wednesday's close, only to slide back to its opening level by mid morning trade.
During the earlier Asian session, Japan’s TOPIX managed to trim a 0.8 percent slide down to a close that was only 0.25 percent lower. China’s Shanghai Composite went the other way, trading higher for most of the session but then nosediving 1.00 percent into the red, near the bottom of the session, to close at a fresh one-year low.
In stark contrast, Hong Kong’s Hang Seng rebounded from its lowest price since December 7, 2017, sealing a 0.5 percent climb by the end of the morning session. The HK index was helped by gains in energy shares, that were following the price of crude oil higher—an upbeat marker that apparently managed to overshadow investor worries over US-China trade tensions. Technically, the price bounced off the support since October, forming a bullish hammer, upon the close.

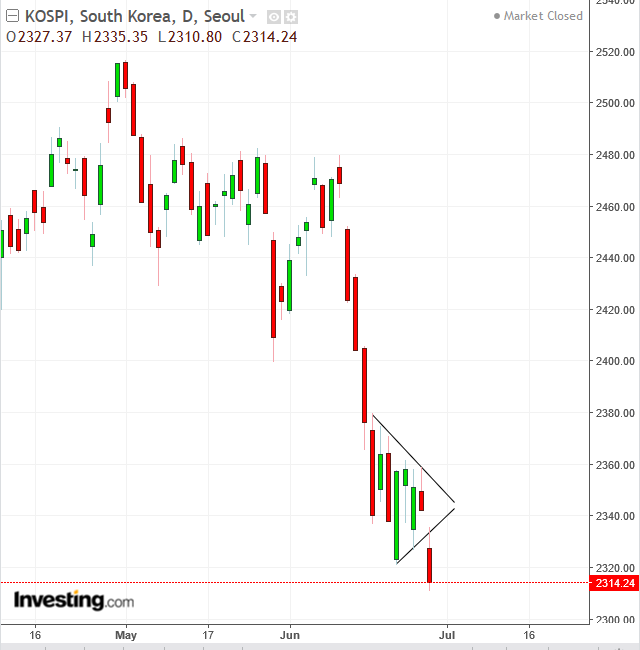
South Korea’s KOSPI dropped 1.15 percent, forming a downside breakout on a breakaway gap of a 6-day consolidation. It formed a pennant—a continuation pattern—as it registered the lowest closing price since May 23, 2017.
Australia’s S&P/ASX 200 resumed its climb higher, bucking the regional trend, closing 0.3 percent in the green, after slipping lower alongside other regional indices over the previous four sessions. The advance it posted today may have completed a bullish falling flag.
Global Financial Affairs
Today's volatile global equity market performance follows a roller coaster ride during yesterday's US session. US markets opened on a strong note and inched higher for the first two hours, following a European rally that had defied the earlier Asian share slump.
The initial rally followed reports that the Trump's administration had softened its plans to crack down on Chinese investments into US technology, as the government would rely on advice from a committee to consider any sensitive case. The news that US President Donald Trump was supporting this more nuanced approach was enough to send the S&P 500 0.9 percent higher.
However, after Larry Kudlow, who serves as National Economic Council Director, later reasserted the administration’s hard line on trade, a selloff ensued. Tech shares understandably bore the brunt of the selling, which saw the SPX tumbling 0.86 into negative territory. Bank stocks on the US benchmark slipped lower for a record 13th straight day.

The greenback, however, kept strengthening, hitting its highest levels since July 2017—this time in line with US yields, which ended a three-day slide. The USD extended a peak that overcame the preceding, November high.
The stronger dollar continues to wreak havoc on emerging market assets.

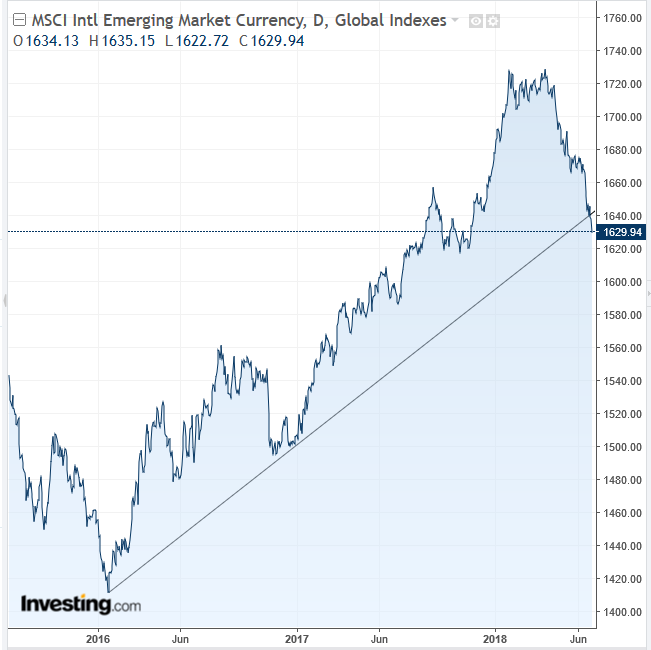
The MSCI Emerging Market Currency Index touched the lowest level in almost a year, falling below an uptrend line since January 2016.
And the Indian rupee reached an all-time low of just above 69 against the dollar yesterday, taking a beating from both the stronger dollar and soaring oil prices. India is the world's third-largest oil consumer. It relies on imports to cover two-thirds of its fuel demand.
Higher oil prices force the country to sell more rupees to buy dollars with which to purchase USD-denominated oil. Moreover, the ongoing FX outflows drive institutional investors to raise their bearish stance on the Indian currency, exacerbating its downward spiral. Barclay's analysts, for example, forecast that the USD/INR pair will hit the 72.00 level this year.
The Chinese yuan is currently fluctuating, after suffering its longest losing streak in years, as it tumbled lower for 8 out of 9 sessions.
WTI crude gave up some gains after hitting its highest price in more than three years on Wednesday. At the current price, just a hair below $73 at time of writing, the commodity is on track to close at its highest level since November 2014.
Up Ahead
Market Moves
Stocks
Currencies
Bonds
Commodities
