


Sign up to create alerts for Instruments,
Economic Events and content by followed authors
Free Sign Up Already have an account? Sign In
Please try another search
| Symbol | Exchange | Currency | ||
|---|---|---|---|---|
| GYC | Xetra | EUR | Delayed | |
| GYCd | BATS Europe | EUR | Delayed | |
| GYC | TradeGate | EUR | Delayed | |
| GYC | Frankfurt | EUR | Delayed | |
| GYC | Vienna | EUR | Real-time |
| Pattern | Timeframe | Reliability | Candles Ago | Candle Time | |
|---|---|---|---|---|---|
| Emerging Patterns | |||||
| Bullish Engulfing | 1D | Current | |||
| Bullish Engulfing | 5H | Current | |||
| Bullish Engulfing | 1H | Current | |||
| Completed Patterns | |||||
| Bullish Engulfing | 1W | 2 | Apr 28, 2024 | ||
| Belt Hold Bearish | 30 | 2 | May 15, 2024 03:30AM | ||
| Three Outside Down | 1M | 3 | Feb 24 | ||
| Harami Cross | 1W | 3 | Apr 21, 2024 | ||
| Bullish Engulfing | 30 | 3 | May 15, 2024 03:00AM | ||
| Engulfing Bearish | 1M | 4 | Jan 24 | ||
| Upside Gap Three Methods | 1M | 4 | Jan 24 | ||
| Engulfing Bearish | 1W | 4 | Apr 14, 2024 | ||
| Doji Star Bearish | 15 | 5 | May 15, 2024 03:15AM | ||
| Three Outside Up | 15 | 5 | May 15, 2024 03:15AM | ||
| Falling Three Methods | 1H | 6 | May 14, 2024 07:00AM | ||
| Belt Hold Bearish | 30 | 6 | May 14, 2024 10:30AM | ||
| Dark Cloud Cover | 30 | 6 | May 14, 2024 10:30AM | ||
| Bullish Engulfing | 15 | 6 | May 15, 2024 03:00AM | ||
| Belt Hold Bullish | 1H | 7 | May 14, 2024 06:00AM | ||
| Three Inside Up | 1H | 7 | May 14, 2024 06:00AM | ||
| Abandoned Baby Bullish | 15 | 9 | May 14, 2024 11:00AM | ||
| Bullish Engulfing | 30 | 10 | May 14, 2024 08:30AM | ||
| Three Outside Up | 1D | 11 | Apr 29, 2024 | ||
| Inverted Hammer | 1H | 11 | May 13, 2024 11:00AM | ||
| Belt Hold Bearish | 15 | 11 | May 14, 2024 10:30AM | ||
| Engulfing Bearish | 15 | 11 | May 14, 2024 10:30AM | ||
| Belt Hold Bullish | 1D | 12 | Apr 26, 2024 | ||
| Bullish Engulfing | 1D | 12 | Apr 26, 2024 | ||
| Harami Bullish | 1W | 13 | Feb 11, 2024 | ||
| Inverted Hammer | 1D | 13 | Apr 25, 2024 | ||
| Harami Bullish | 5H | 13 | May 07, 2024 11:00AM | ||
| Falling Three Methods | 1M | 14 | Mar 23 | ||
| Harami Bullish | 1H | 14 | May 13, 2024 08:00AM | ||
| Harami Cross | 1H | 14 | May 13, 2024 08:00AM | ||
| Three Outside Up | 30 | 14 | May 14, 2024 06:30AM | ||
| Bullish doji Star | 1W | 15 | Jan 28, 2024 | ||
| Belt Hold Bullish | 30 | 15 | May 14, 2024 06:00AM | ||
| Bullish Engulfing | 30 | 15 | May 14, 2024 06:00AM | ||
| Harami Bullish | 5H | 17 | May 06, 2024 05:00AM | ||
| Thrusting Bearish | 1W | 18 | Jan 07, 2024 | ||
| Doji Star Bearish | 15 | 18 | May 14, 2024 08:45AM | ||
| Three Inside Up | 30 | 19 | May 14, 2024 04:00AM | ||
| Bullish Engulfing | 15 | 19 | May 14, 2024 08:30AM | ||
| Harami Cross Bearish | 30 | 22 | May 13, 2024 11:30AM | ||
| Tri-Star Bearish | 15 | 22 | May 14, 2024 07:15AM | ||
| Abandoned Baby Bullish | 1H | 23 | May 10, 2024 08:00AM | ||
| Bullish Engulfing | 1H | 23 | May 10, 2024 08:00AM | ||
| Bullish doji Star | 1M | 24 | May 22 | ||
| Bullish doji Star | 1H | 24 | May 10, 2024 07:00AM | ||
| Belt Hold Bullish | 30 | 24 | May 13, 2024 10:30AM | ||
| Dragonfly Doji | 30 | 26 | May 13, 2024 09:30AM | ||
| Tri-Star Bullish | 15 | 26 | May 14, 2024 06:15AM | ||
| Bullish Hammer | 1M | 27 | Feb 22 | ||
| Dragonfly Doji | 1M | 27 | Feb 22 | ||
| Bullish doji Star | 1M | 29 | Dec 21 | ||
| Dragonfly Doji | 1M | 29 | Dec 21 | ||
| Harami Bullish | 30 | 29 | May 13, 2024 07:30AM | ||
| Harami Cross | 30 | 29 | May 13, 2024 07:30AM | ||
| Three Black Crows | 30 | 30 | May 13, 2024 07:00AM | ||
| Three Black Crows | 1W | 31 | Oct 08, 2023 | ||
| Belt Hold Bullish | 5H | 31 | Apr 26, 2024 12:00AM | ||
| Bullish Engulfing | 5H | 31 | Apr 26, 2024 12:00AM | ||
| Engulfing Bearish | 1M | 32 | Sep 21 | ||
| Belt Hold Bearish | 30 | 32 | May 13, 2024 05:30AM | ||
| Engulfing Bearish | 30 | 32 | May 13, 2024 05:30AM | ||
| Doji Star Bearish | 1D | 34 | Mar 25, 2024 | ||
| Belt Hold Bullish | 5H | 34 | Apr 24, 2024 11:00PM | ||
| Evening Star | 30 | 34 | May 13, 2024 04:00AM | ||
| Evening Doji Star | 30 | 34 | May 13, 2024 04:00AM | ||
| Abandoned Baby Bearish | 30 | 34 | May 13, 2024 04:00AM | ||
| Advance Block Bearish | 1W | 35 | Sep 10, 2023 | ||
| Doji Star Bearish | 30 | 35 | May 13, 2024 03:30AM | ||
| Gravestone Doji | 30 | 35 | May 13, 2024 03:30AM | ||
| Rising Three Methods | 30 | 36 | May 13, 2024 03:00AM | ||
| Belt Hold Bullish | 15 | 36 | May 14, 2024 03:00AM | ||
| Bullish Engulfing | 15 | 36 | May 14, 2024 03:00AM | ||
| Belt Hold Bearish | 1H | 37 | May 09, 2024 03:00AM | ||
| Harami Cross | 1W | 38 | Aug 20, 2023 | ||
| Upside Gap Three Methods | 1D | 40 | Mar 15, 2024 | ||
| Thrusting Bearish | 30 | 40 | May 10, 2024 10:00AM | ||
| Belt Hold Bullish | 15 | 40 | May 13, 2024 10:30AM | ||
| Three Inside Up | 5H | 41 | Apr 22, 2024 01:00AM | ||
| Harami Cross | 1M | 42 | Nov 20 | ||
| Thrusting Bearish | 1D | 42 | Mar 13, 2024 | ||
| Harami Bullish | 5H | 42 | Apr 19, 2024 08:00AM | ||
| Three Outside Up | 1W | 43 | Jul 16, 2023 | ||
| Bullish Engulfing | 30 | 43 | May 10, 2024 08:00AM | ||
| Falling Three Methods | 15 | 43 | May 13, 2024 09:30AM | ||
| Bullish Engulfing | 1W | 44 | Jul 09, 2023 | ||
| Bullish Engulfing | 5H | 44 | Apr 18, 2024 07:00AM | ||
| Doji Star Bearish | 1W | 45 | Jul 02, 2023 | ||
| Bullish doji Star | 30 | 45 | May 10, 2024 07:00AM | ||
| Homing Pigeon | 5H | 46 | Apr 17, 2024 11:00AM | ||
| Harami Bullish | 15 | 48 | May 13, 2024 07:45AM | ||
| Harami Cross | 15 | 48 | May 13, 2024 07:45AM | ||
| Bullish doji Star | 5H | 49 | Apr 16, 2024 10:00AM | ||
| Bullish Engulfing | 30 | 49 | May 10, 2024 05:00AM | ||
| Gravestone Doji | 1D | 50 | Mar 01, 2024 | ||
| Engulfing Bearish | 1M | 51 | Feb 20 | ||
| Upside Gap Three Methods | 5H | 52 | Apr 15, 2024 09:00AM | ||
| Engulfing Bearish | 1H | 52 | May 07, 2024 06:00AM | ||
| Belt Hold Bearish | 15 | 52 | May 13, 2024 05:30AM | ||
| Engulfing Bearish | 15 | 52 | May 13, 2024 05:30AM | ||
| Harami Cross Bearish | 1H | 53 | May 07, 2024 05:00AM | ||
| Shooting Star | 30 | 53 | May 10, 2024 03:00AM | ||
| Three Inside Up | 5H | 54 | Apr 14, 2024 11:00PM | ||
| Harami Cross Bearish | 30 | 54 | May 09, 2024 11:30AM | ||
| Belt Hold Bearish | 1H | 55 | May 07, 2024 03:00AM | ||
| Engulfing Bearish | 1H | 55 | May 07, 2024 03:00AM | ||
| Doji Star Bearish | 15 | 56 | May 13, 2024 03:30AM | ||
| Gravestone Doji | 15 | 56 | May 13, 2024 03:30AM | ||
| Harami Bullish | 1M | 58 | Jul 19 | ||
| Inverted Hammer | 1M | 58 | Jul 19 | ||
| Morning Doji Star | 1W | 58 | Apr 02, 2023 | ||
| Engulfing Bearish | 1M | 59 | Jun 19 | ||
| Bullish doji Star | 1W | 59 | Mar 26, 2023 | ||
| Separating Lines Bullish | 30 | 60 | May 09, 2024 08:30AM | ||
| Homing Pigeon | 1H | 61 | May 06, 2024 06:00AM | ||
| Belt Hold Bearish | 30 | 61 | May 09, 2024 07:00AM | ||
| Belt Hold Bullish | 1D | 62 | Feb 14, 2024 | ||
| Harami Bullish | 1W | 63 | Feb 26, 2023 | ||
| Harami Cross | 1W | 63 | Feb 26, 2023 | ||
| Morning Doji Star | 1D | 64 | Feb 12, 2024 | ||
| Morning Star | 1D | 64 | Feb 12, 2024 | ||
| Bullish doji Star | 1D | 65 | Feb 09, 2024 | ||
| Belt Hold Bearish | 5H | 65 | Apr 09, 2024 03:00AM | ||
| Dark Cloud Cover | 5H | 65 | Apr 09, 2024 03:00AM | ||
| Three Black Crows | 1D | 66 | Feb 08, 2024 | ||
| Belt Hold Bearish | 30 | 66 | May 09, 2024 03:00AM | ||
| Falling Three Methods | 1D | 67 | Feb 07, 2024 | ||
| Morning Doji Star | 1H | 67 | May 03, 2024 09:00AM | ||
| Harami Cross Bearish | 15 | 67 | May 10, 2024 08:30AM | ||
| Dark Cloud Cover | 1D | 68 | Feb 06, 2024 | ||

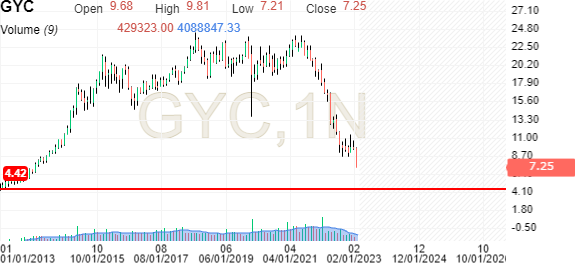
 Hello James, it's an estimation I made based on the monthly chart. January and February 2013 lows were around 4.42€. Current PER is 9.51 and dividend yield has been cut to 0% in 2022. Interest rates keep rising at the moment and before the SVB, FRC, Credit Suisse fall; investors thought they would go up until 5.5-6%. Even though debt is lower than its bigger competitor Vonovia and according to GYC website the company’s debt have a 95% interest hedging ratio, which is expected to reduce to 91% as some interest rate hedging matures throughout 2023; in an environment of increasing interest rates, investors could switch from REITs to bonds. The fact that GYC cut its dividend to 0, may look very disciplined and responsible. But a REIT who does not pay dividend is no longer attractive in my opinion. Whether it will be at 10-15€ in the next 4-5 years, that depends on: inflation stabilisation, interest rates beginning to drop at comfortable levels (1-3%), reduced banking crisis uncertainty and reduced recession fears, among other factors.
Are you sure you want to block %USER_NAME%?
By doing so, you and %USER_NAME% will not be able to see any of each other's Investing.com's posts.
%USER_NAME% was successfully added to your Block List
Since you’ve just unblocked this person, you must wait 48 hours before renewing the block.
I feel that this comment is:
Thank You!
Your report has been sent to our moderators for review