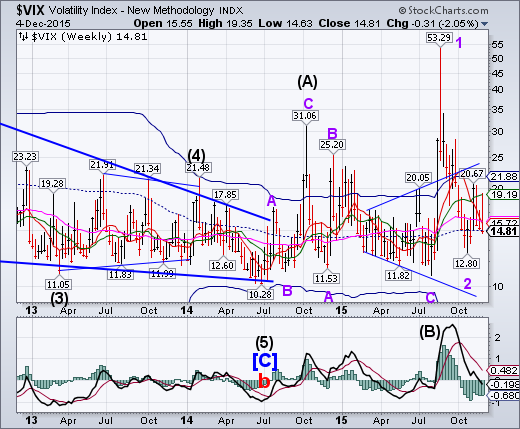
VIX closed the week beneath its mid-Cycle support/resistance at 14.96, but stayed above its Master cycle low on Tuesday at 14.63. Its new breakout levels are at 19.35 and 20.67 to re-establish a bullish trend. While traders are anticipating a calmer season ahead, the VIX warns the opposite may happen.
SPX bounces off its trendline.
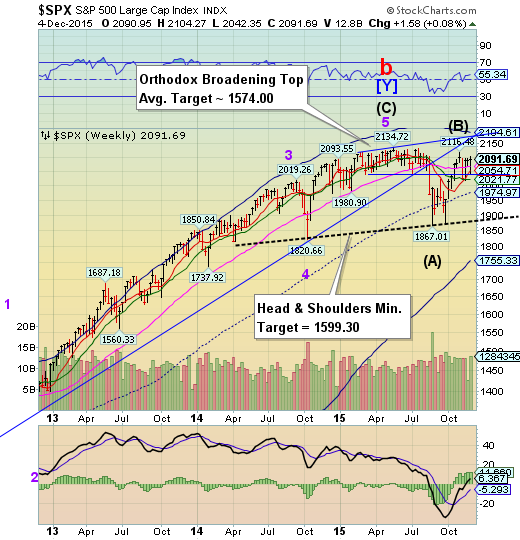
The SPX bounced off its Orthodox Broadening Top trendline for a 78.6% retracement of its decline to that formation. The Broadening Top formation may be triggered at the next decline through that level. Long-term support is at 2066.59. A drop beneath that level puts SPX on a sell signal
(ZeroHedge) Earlier today we reported that the primary catalyst for today's surge in stocks was Mario Draghi's speech in NY attempt to cover up the ECB's latest policy error as virtually every sellside analyst called Draghi's 'disappointing" decision to jawbone expectations from the ECB to the stratosphere only to fall woefully short and lead to a 500 point plunge in the DAX and the biggest surge in the EUR/USD since the announcement of QE1).
But nothing was a bigger catalyst in setting the market's euphoric mood than the following exchange between Mervyn King, in which the former BOE chief asked "was today's speech deliberately designed to try offset some of the reaction yesterday?" to which Draghi had a response that shocked every central bank watcher in its brutal honesty that all that matters to the ECB at this point is the market:"Not really... well, of course."
NDX makes a nominal new high.
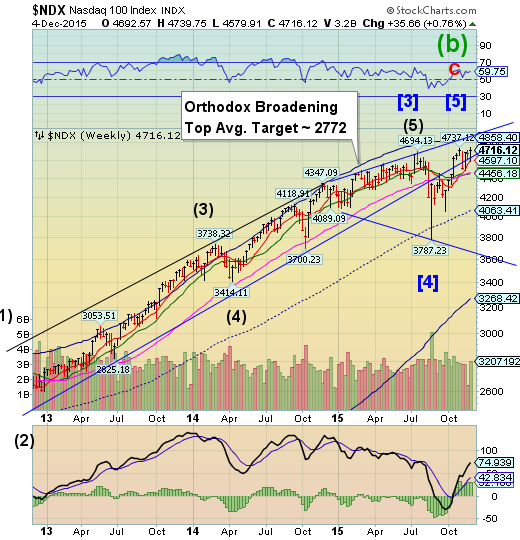
NDX made a nominal new high this week at 4739.75 this week after bouncing off Short-term support currently at 4597.71. Point 6, which is likely to be near its Cycle Bottom support at 3268.42, may be its next target. This may happen in a surprisingly short period of time.
(ZeroHedge) This is not your father's market. Rather, it's a random walk -- and nearly unplayable from day to day unless you're very fleet of foot.
These spastic daily market moves are in a large part governed by quant strategies that are agnostic to underlying values and have partly invalidated the interpretation of price charts and trends. They've also rendered technical analysis far less valuable than it was in the past.
High Yield Bonds are finding support at mid-Cycle line.
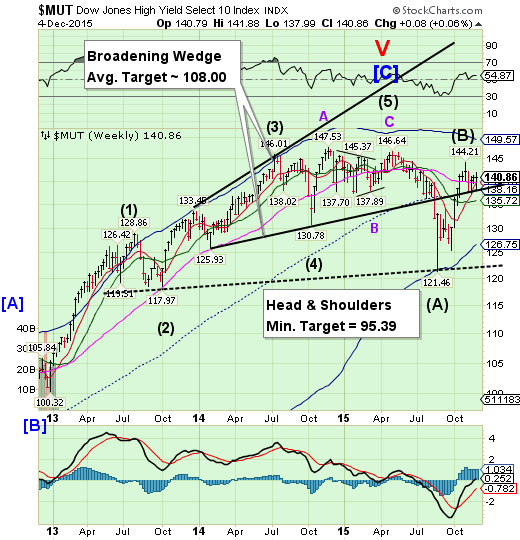
The High Yield Index tested weekly mid-Cycle support at 138.16 and the Broadening Wedge trendline again. Despite the support of the mid-Cycle level, the Cycles Model suggests a major decline in HY over the next several weeks. This kind of action may give a false sense of stability.
(ZeroHedge) The credit cycle has finally turned: one can see it everywhere - from the rapidly deteriorating corporate fundamentals, to the recent surge in defaults and downgrades, to the tightening lending standards, to the most obvious - sliding asset prices. Nowhere is the bursting of the credit bubble more obvious than in the spread between junk spreads and the equity market,
The euro bounces from the lower trendline.
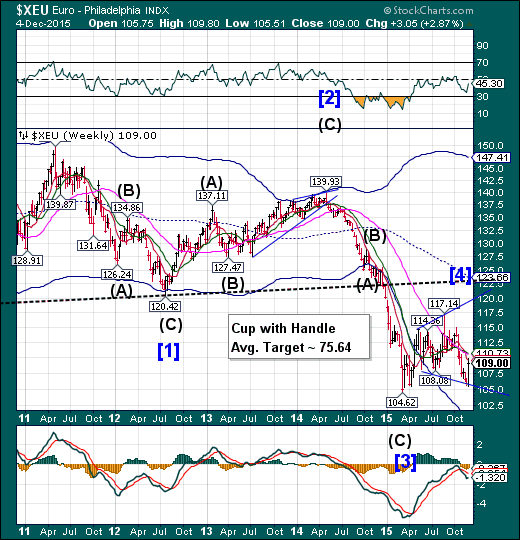
The euro bounced from lower trendline of its Flag formation on Thursday to challenge the resistance cluster at 109.61 – 110.73. The minimum resistance was challenged, suggesting a continuation to a higher level. It is likely to target the 117.00 – 120.00 range before reversing down. It is these kind of retracements that shake out the weaker shorts.
(ZeroHedge) Following yesterday's crash in the DAX, and historic surge in the euro after an ECB announcement which many suggested was another central bank policy error, moments ago Mario Draghi did everything in his power to reverse said error, when in a speech in New York which concluded moments ago followed by a Q&A session, he effectively tripled down on his "whatever it takes" position (remember his double down took place in Malta at the end of October) and said that not only is "QE there to stay," but could be "calibrated" if needed and the ECB can use "further tools" if needed as there is "no limit" to the "size of the ECB's balance sheet."
EuroStoxx are in another Broadening formation.
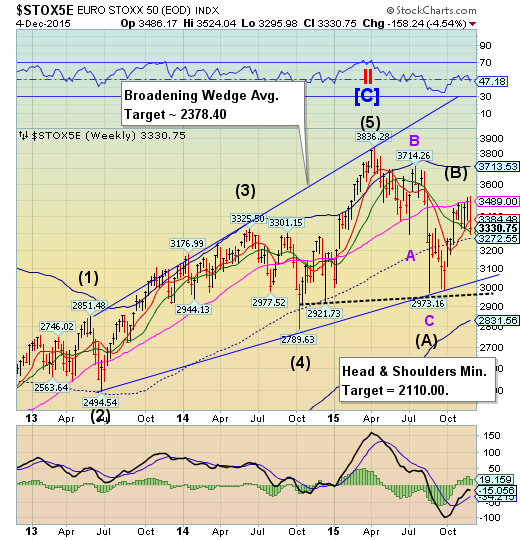
EuroStoxx declined to close above a lower Intermediate-term support at 3306.59 in another Broadening formation that may prove to be the final reversal. A loss of mid-Cycle support at 3272.55may be problematic, as a further decline may trigger a larger sell-off. Should that occur, EuroStoxx may remain in a decline through the end of the year.
(Reuters) Investors continued to rack up purchases of global stocks last week, with European equity funds attracting inflows for the 27th week out of the last 29, Bank of America Merrill Lynch (N:BAC) said on Friday.
The $2.3 billion inflow into Europe brought the year-to-date total up to $115.2 billion, representing a "huge" 10.4 percent of funds' assets under management, BAML said.
"Pain trade" is how BAML described the build-up in positioning.
The flows data are for the week to Wednesday, a day before the European Central Bank surprised markets with a smaller package of stimulus measures than had been expected. This triggered a 3.3 percent slide in European stocks on Thursday.
The yen builds a base.
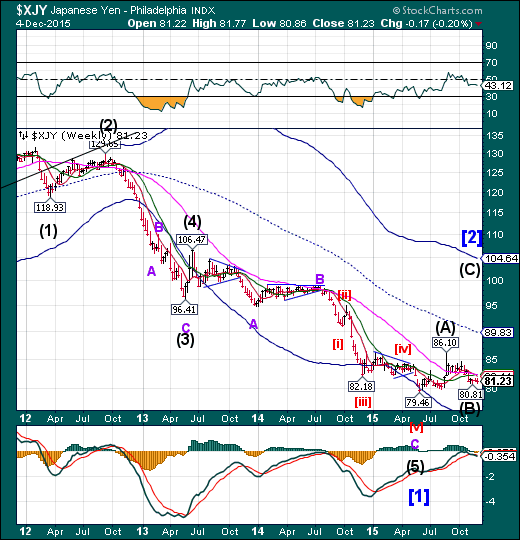
The yen appears to have completed a bullish Flag formation on November 18 and appears to be building a base that implies a target at or above mid-Cycle resistance at 89.83. The bounce may last through the middle of December.
(Bloomberg) Market strategists are having a tough time picking where the yen and the Australian dollar are going.
The median year-end forecasts for those currencies against the U.S. dollar missed the mark by an average of at least 12 percent over the past decade, according to data compiled by Bloomberg. The analysts are on course for an 8 percent gap on their Aussie estimates in 2015.
“The yen is very difficult to predict because, on top of being one of the lowest-yielding currencies, it is bought when risk aversion is in play,” said Hideo Shimomura, chief fund manager at Mitsubishi UFJ Kokusai Asset Management. “It’s also difficult to come up with forecasts for a high-yielding currency like the Aussie because its volatility is higher.”
The Nikkei reversed from its retracement high.
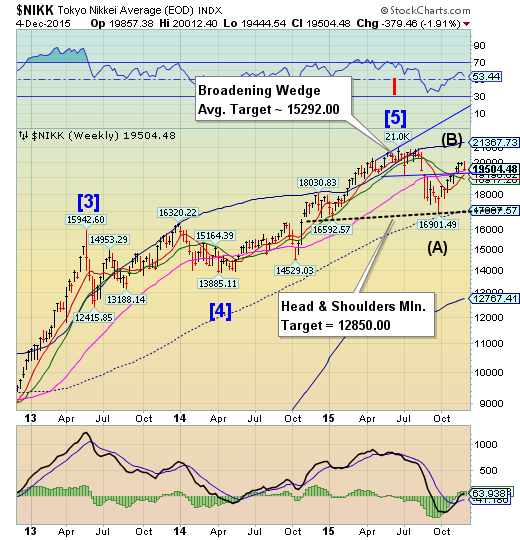
The Nikkei challenged its Long-term support at 19456.17 before closing above it this week. A decline beneath it may also trigger the Broadening formation that implies a probable 20% correction. A probable reversal may be at hand, with weakness in the Cycle showing for the next three weeks. Should the subsequent decline go beneath mid-cycle support at 17067.57, the Nikkei may experience a flash crash taking it to its cycle Bottom support at 12767.41.
(Reuters) Nikkei share average suffered its biggest daily drop in more than a month on Friday morning as the European Central Bank dashed expectations for greater stimulus, triggering a broader sell-off after the dollar weakened against the yen.
The ECB cut its deposit rate deeper into negative territory and extended its asset buying by six months -- widely anticipated moves that some investors considered the bare minimum after the bank had for weeks stoked expectations of stimulus moves. The central bank's move sapped appetite for Japanese equities, which had priced in a more aggressive stimulus, traders said.
The Nikkei dropped 1.6 percent to 19,622.60 in mid-morning trade after falling as much as 1.9 percent to 19,553.65 earlier, the lowest level in nearly three weeks and the biggest daily percentage drop since Nov. 2.
U.S. dollar pulls back from Round Number resistance
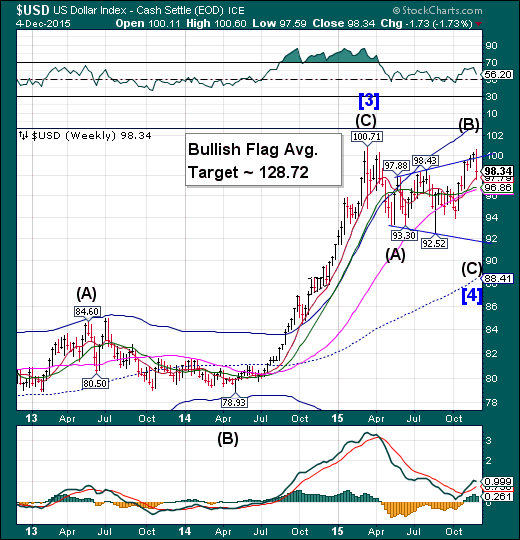
The US dollar challenged Round Number resistance again, but could not exceed its March 16 high of 100.71. The Cycles Model calls for a pullback that may violate Long-term support, currently at 96.66, but should a financial event happen, it may decline to trendline support near 92.00. The Cycles Model calls for a Master Cycle low by mid-December, so this decline may be rather fast. Speculators may be caught the wrong way in their positions, causing a shake-out of the longs.
(Reuters) Speculators slightly pared bullish bets on the U.S. dollar in the latest week, according to Reuters calculations and data from the Commodity Futures Trading Commission released on Friday.
The value of the dollar's net long position slipped to $43.47 billion in the week ended Dec. 1, from $44.05 billion the previous week. It was the third straight week that the net long position on the greenback was at more than $40 billion.
To be long a currency is to make a bet it will rise, while being short is a bet the currency's value will decline.
USB challenges overhead resistance.
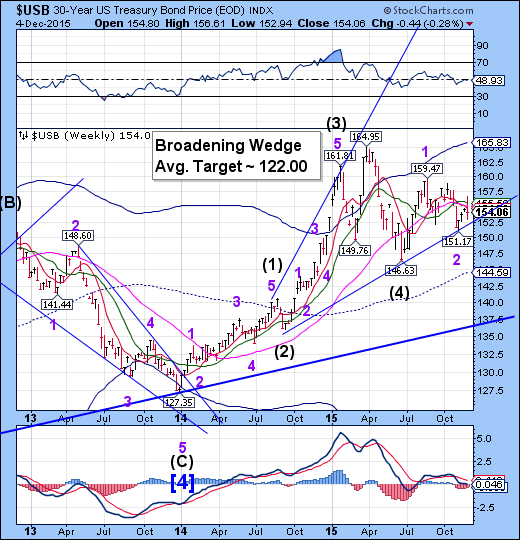
The Long Bond challenged Long-term resistance at 155.10 and Intermediate-term resistance at 155.59 before closing beneath both. A challenge of resistance where it is exceeded often has the same effect as a breakout, where a consolidation occurs before moving higher. The Cycles Model suggests a period of strength lasting through mid-December.
(Reuters) Yields on U.S. Treasuries fell on Friday, with investors caught between a stronger-than-expected November jobs report that built the case for an interest rate hike and a drop in oil prices after OPEC surprisingly raised its production ceiling.
Yields initially rose after the U.S. Labor Department said nonfarm payrolls increased 211,000 last month and September and October data was revised to show 35,000 more jobs than previously reported.
"The jobs report seals December for the rate hike by the Fed, but now the focus is shifting onto the pace of increases going forward," said Justin Lederer, Treasury strategist at Cantor Fitzgerald in New York.
Gold breaks out above its Cycle Bottom.
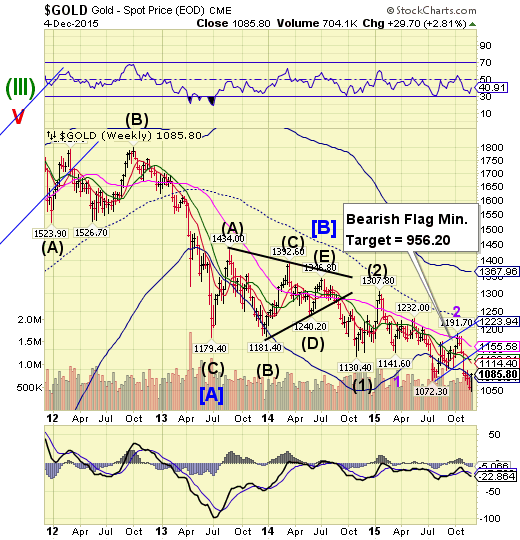
Gold made a new Master Cycle low of 1045.40 on Thursday, then broke out above its Cycle Bottom resistance at 1079.91 on Friday, suggesting the rally may proceed higher. This low had been delayed, which may leave less time for the retracement. The Cycles Model anticipates both time and price, which have been accomplished this week. The rally may not last beyond two weeks.
(TheWeek) Everything had been going as one might have expected. A crucial non-farms payroll report came in strong, analysts proclaimed that a rates rise next month is now all but assured and the gold price… rose.
In theory, non-yielding assets like gold do not react well to increasing rates, as they look less attractive relative to income-bearing assets. The metal also moves in the opposite direction to the dollar by convention, as it is traded as a safe-haven pseudo-currency and a hedge for the greenback.
This latter explains why gold confounded expectations. Despite the non-farms payroll report beating expectations with 211,000 new jobs – and an October revision taking that month to a massive 298,000 - the dollar barely moved
Crude is at a crossroads.
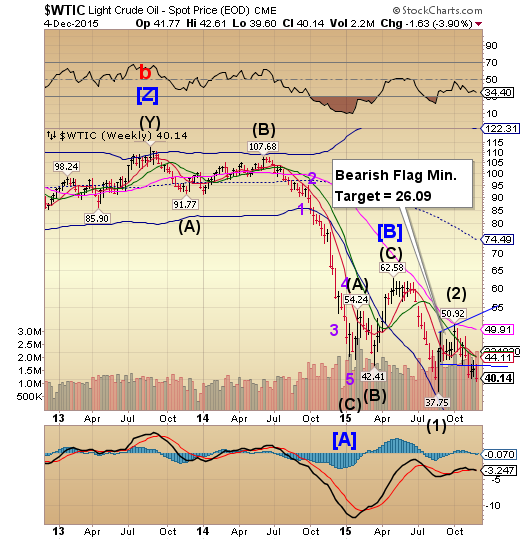
Crude may have made its Master Cycle low on Monday, November 18 at 40.06. However, the bounce was muted and was repelled at intermediate-term resistance the entire time. This week crude broke down beneath that Master Cycle low, suggesting that the rally may have been truncated. The probability of a decline to the Flag target is running high. Note that the Cycle Bottom Support is at 26.63.
(BusinessInsider) Crude oil prices collapsed after a report crossed that the 12-member oil cartel OPEC is not cutting its production levels.
The group decided to maintain production at 31.5 million barrels per day at its meeting in Vienna on Friday. But it remained divided over its production ceiling, and failed to reach an agreement.
In New York, West Texas Intermediate crude futures fell by as much as 2% and below $40 per barrel, to as low as $39.61. In August, WTI fell to a six-year low of $37.75.
Shanghai Index challenged Intermediate-term support.
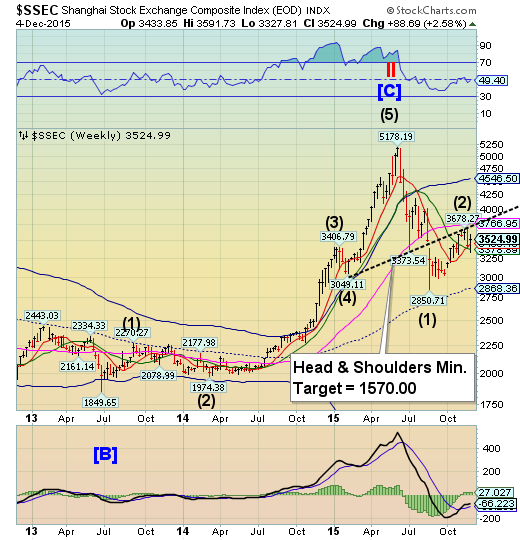
The Shanghai Index declined beneath Intermediate-term support at 3378.89, but made a 79.5% retracement of its decline. What may keep this move bearish is the resistance offered by the Head & Shoulders neckline. In addition, this rally may be considered a bearish Flag formation that may even be more bearish than the Head & Shoulders pattern.
(ZeroHedge) We’ve spent quite a bit of time over the last five months documenting China’s epic “kill the chicken to scare the monkey” campaign.
In the wake of a dramatic unwind in the half dozen or so backdoor margin lending channels that helped to pump some CNY1.5 trillion into Chinese equities during the first half of the year, Beijing embarked on an epic quest to shore up the market. Initially, authorities attempted to stabilize things by pumping hundreds of billions of yuan into the market via CSF. When that became too expensive, the Politburo simply started arresting people.
The witch hunt (and that’s exactly what it is) spread quickly to a number of high profile brokerage houses and before you knew it, China was arresting members of the plunge protection team.
The Banking Index tested Long-term support, then bounced higher.
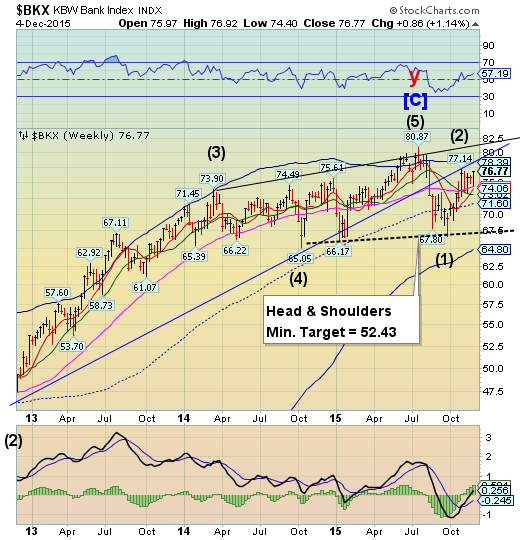
BKX bounced from Long-term support at 74.39 to make a secondary retracement high. However, it is now overdue for a Major low, suggesting a retest of the Head & Shoulders neckline in the next two weeks.. There seems to be a lack of awareness of the magnitude of a potential decline.
(Mises) Most experts are of the view that the massive monetary pumping by the US central bank during the 2008 financial crisis saved the US and the world from another Great Depression. On this, the Federal Reserve Chairman at the time Ben Bernanke is considered the man that saved the world. Bernanke in turn attributes his actions to the writings of Professor Milton Friedman, who blamed the Federal Reserve for causing the Great Depression of 1930s by allowing the money supply to plunge by over 30 percent.
Careful analysis will however show that it is not a collapse in the money stock that sets in motion an economic slump as such, but rather the prior monetary pumping that undermines the pool of real funding that leads to an economic depression.
(ZeroHedge) Ripping straight from the pages of the "those who failed to learn from history are doomed... period" book of centrally-planned desperation to maintain American Dream 'wealth' by unsustainably levitating home prices, the government's bankruptcy mortgage guarantors have just announced "HomeReady Mortgages." These so-called 'enhanced affordable lending products - provided by the US taxpayer - enable 97%-plus Loan-to-Value loans to borrowers based not on their income (which is too low) but on "non-borrowers" like extended family or children! "Whatever it takes" to maintain the illusion of normalcy and hand out more money just reached peak Einsteinian insanity.
(WSJ) European antitrust authorities have dropped a high-profile investigation into 13 of the world’s largest investment banks over alleged collusion in the lucrative credit-derivatives market. The European Commission, the bloc’s top antitrust regulator, had charged the banks two years ago with colluding to prevent the multitrillion-dollar market for credit-default swaps from moving onto regulated exchanges and away from markets controlled by the banks. But in a low-profile statement on Friday, the commission admitted that the “evidence was not sufficiently conclusive to confirm the commission’s concerns with regards to the 13 investment banks.”
(Bloomberg) U.S. regulators are examining whether banks colluded in setting prices in the derivatives market where investors speculate on credit risk, according to a person with knowledge of the matter.
The U.S. Securities and Exchange Commission is probing whether firms acted in unison to distort prices in the $6 trillion market for credit-default swaps indexes, said the person, who asked not to be identified because the investigation is private. The regulator is trying to determine if dealers have misrepresented index prices, the person said. The credit-default swaps benchmarks allow investors to make bets on the likelihood of default by companies, countries or securities backed by mortgages.
