We’ve seen an improvement in equity sentiment through U.S. trade, with implied volatility (I’ve looked at the ‘VIX’ index) falling to 14.95%, with the now closely watched Philadelphia Semiconductor Index rallying over 2%. This has been backed with small gains in Asian equities today. Bond and rates markets are not buying it at this point though, with the UST 5yr holding a 2.40% to 2.20% range (see below) and that is worth watching. Clearly, even if we see a favourable resolution in trade, and that may not even happen this year, private sector demand is not going to increase sufficiently to create lasting inflation.

We have seen an olive branch of sorts extended by both the U.S. administration, and this morning China’s U.S. ambassador offering conciliatory comments that the door is open for talks. All the while, the narrative in the Chinese press and social media is turning far more anti-U.S. Traders don’t know where to turn, but we do know the Chinese are not going to come back to the table when the U.S. is going after Chinese tech. This has been seen case-in-point in the news flow today, and needs attention, with the U.S. looking to put five Chinese surveillance firms on their blacklist. We’ve seen some selling of our U.S. equity indices, but it's still early days.
We also know submissions for all comments and objections for the final $300b tranche of Chinese exports (to the U.S.) are due 24 June. These considerations will be given due attention and should be announced to the waiting world anytime around the 28-29 June, which coincides nicely with the G20 meeting in Japan, where the highlight will be the expected meeting between Xi and Trump.
What is the likelihood we see a rally in risk assets into this period, on the idea of a resolution or at least a more constructive feel to talks? I’d say pretty high.
Until then, here’s what’s getting my attention today:
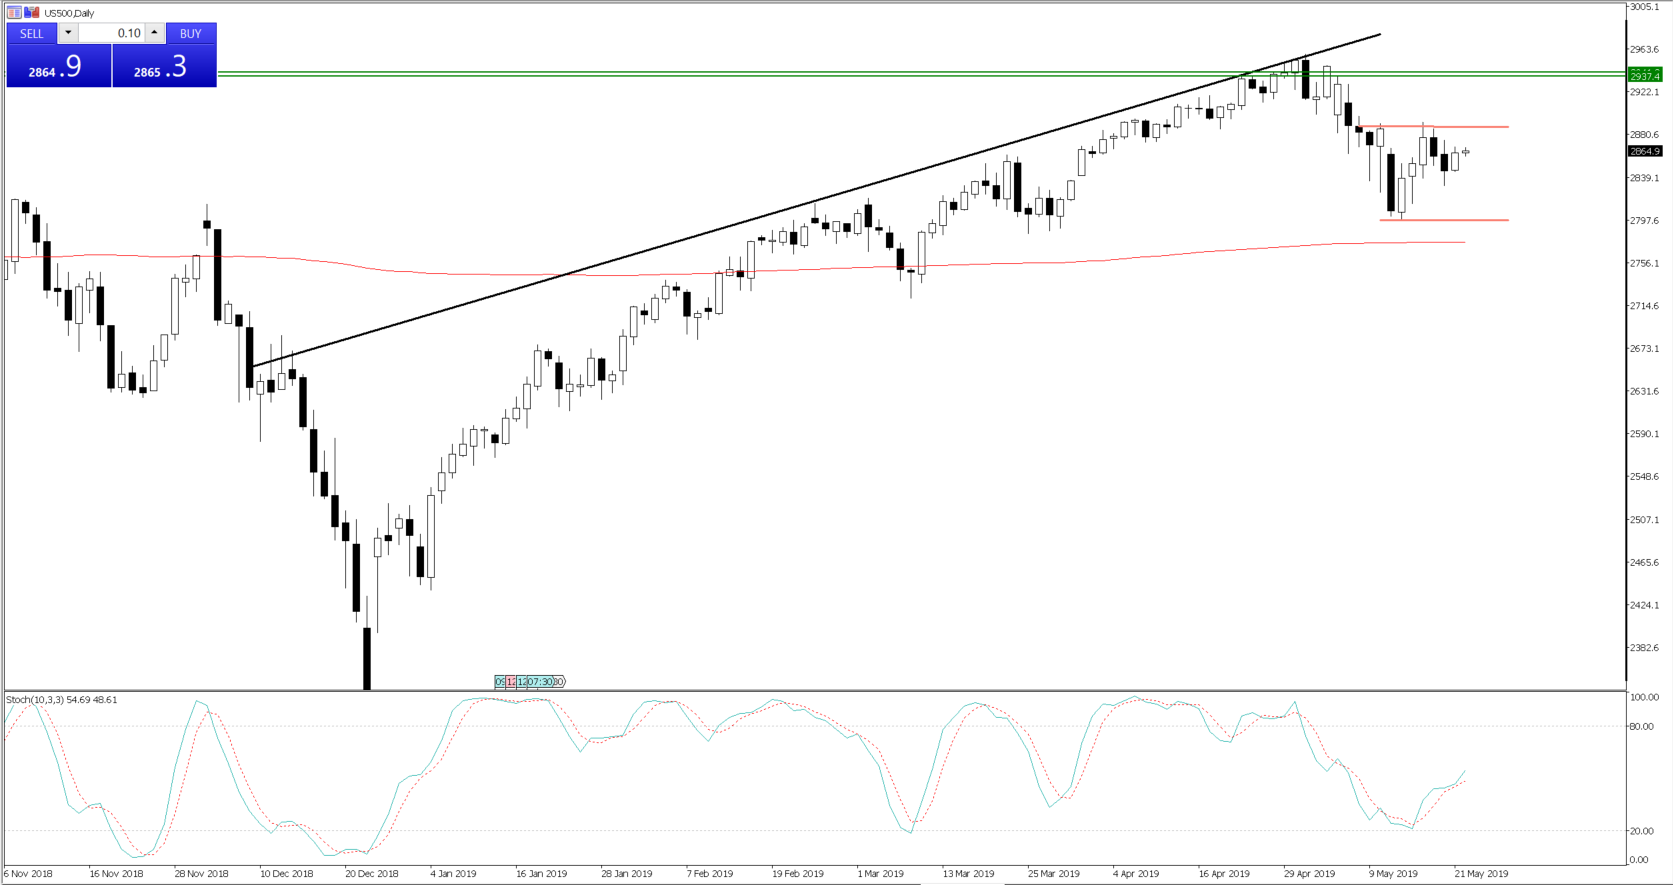
S&P 500 (US500) – I am neutral on the index, but understand the importance this index has on global sentiment. My guidelines are shaped by the portrayed range (2890 – 2796), and a break here should be quite telling. As it stands, there is a clear battle underway between the bulls and the bears and neither party is establishing any dominance - I’d say that seems fair given the macro backdrop.

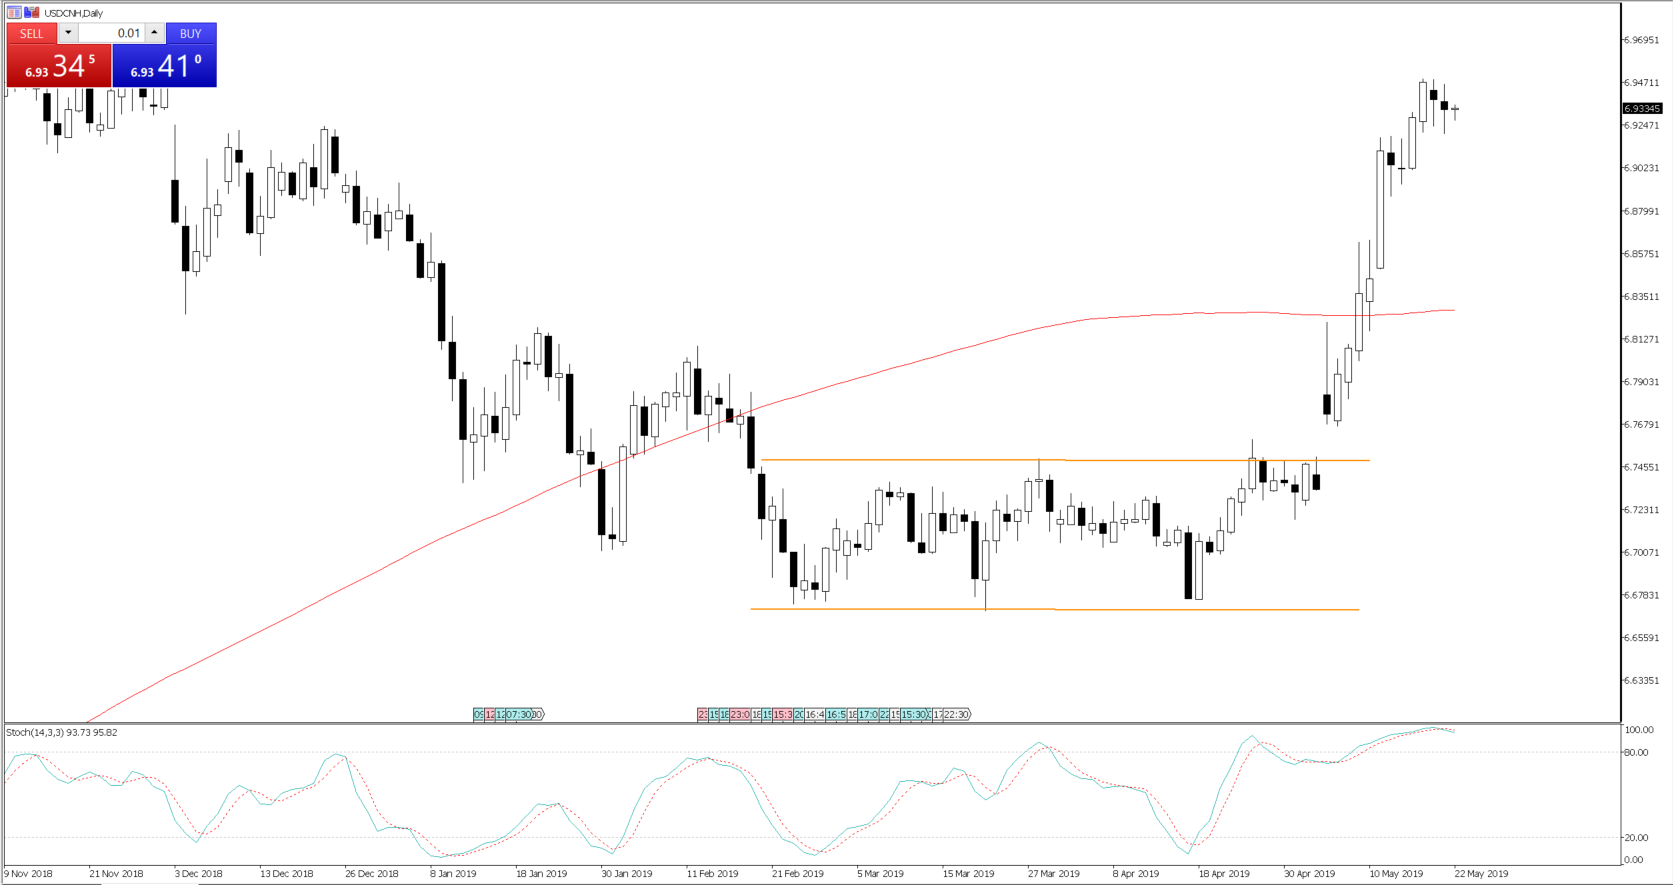
USDCNH (offshore yuan)– Still the most important chart in FX markets here, and is the strategist’s key barometer on trade wars, although AUDJPY and AUDCHF are also trades getting a bit of attention as hedges against a further breakdown in trade talks. All eyes remain on the 7.00 level, and it would be interesting to see if price breaks here in the near-term whether it sets a reaction off in other markets, such as AUDUSD and the AUD crosses. The PBoC is doing their best to convince traders they want a stable yuan, and for the past three days, we have seen them ‘fix’ the mid-point of USDCNY at lower levels than expected, which has sent out a powerful message they don’t want to see the pair higher.
Google (NASDAQ:GOOGL) ‘PBoC CNY daily fixing mechanism’ for more information here.

If we look at the options markets, we can see:
Top pane – USDCNH 1-month implied volatility (IV). This gives us a good sense if traders see more explosive moves (up or down), and given the recent commentary and actions from the PBoC, we can see IV has settled down. We can see greater indecision in the price action and given the lower IV; it feels like we will see consolidation. This should elevate the risk of consolidation in AUDUSD.
Lower pane – USDCNH 1-month risk reversals. This looks at the skew in demand for USDCNH calls options vs put options. After a spike higher, symbolising a strong demand for upside exposures, there is an easing and a more nuanced approach. Again, this throws weight that USDCNH may have had its move and consolidation is likely.

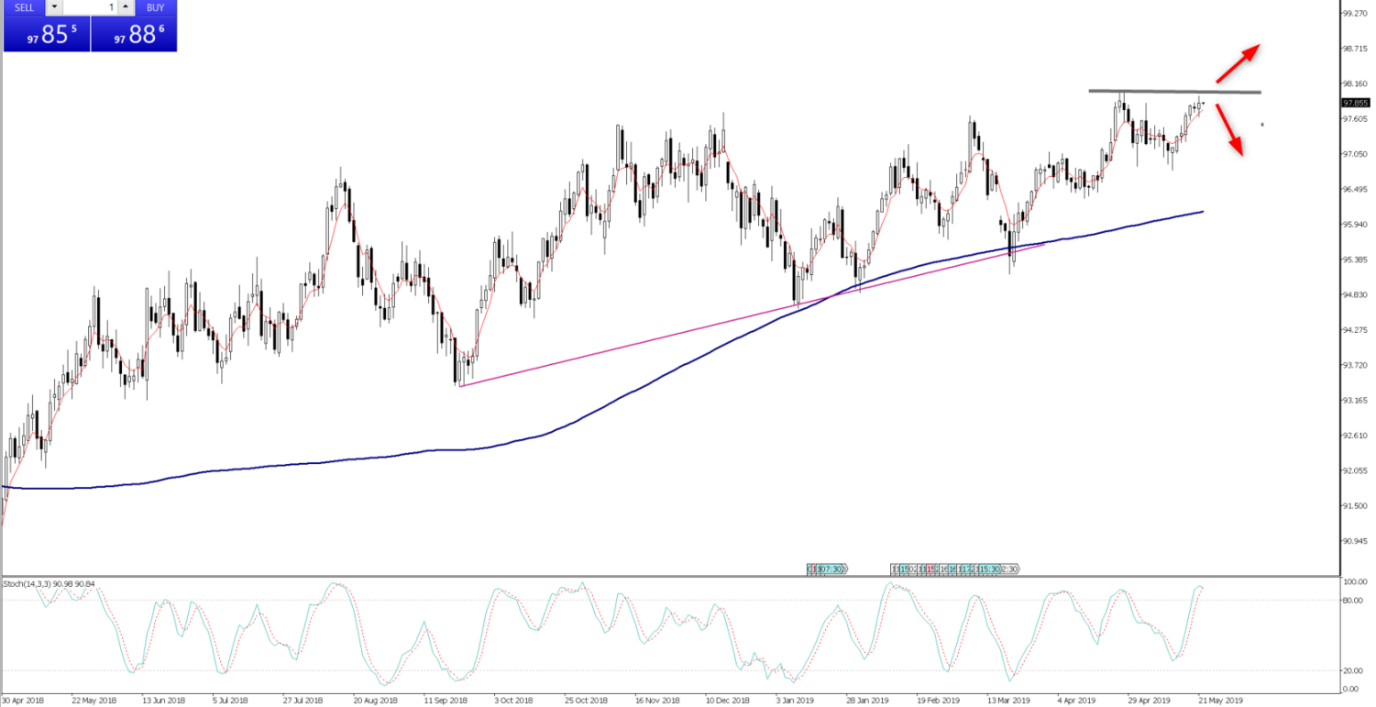
USDX (USD index) – Granted, this basket of currencies traded against the USD has a 57% weight towards the EUR, but a breakout here will get a lot of attention. We have the FOMC minutes at 4 am tonight, and with 23bp of cuts priced into the rates market for this year, if the Fed collective bang the drum that inflation is transitory it will only support the USD. One to watch.

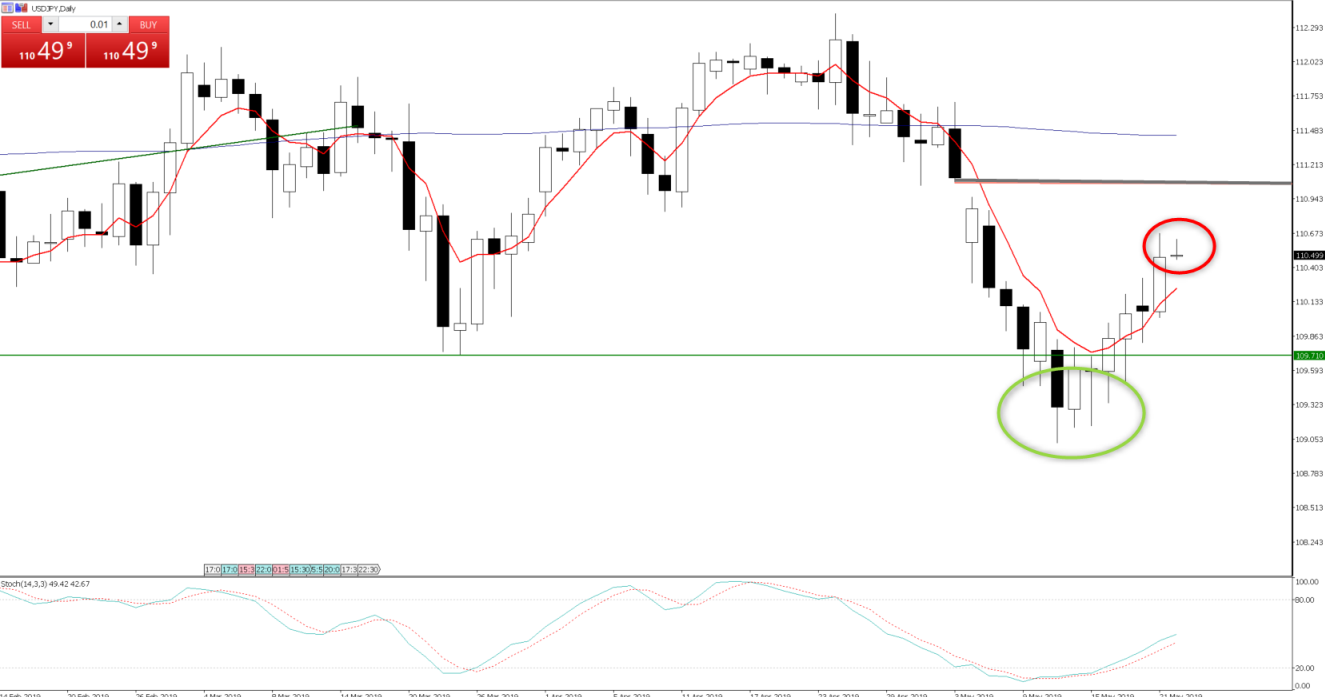
USDJPY – Gaps are there to be filled and after the failed break of the March pivot (green circle), resulting in strong bids coming into the price, and which set the stage for the run into 110.65, there are calls we could see the gap closed at 111.06. That said, today’s candle (red circle) needs close attention, as we made a lower high and price is looking like a gravestone doji, which needs work, but could suggest a short-term top.

I'll be in Queensland for the rest of the week meeting clients, so the next report will be Monday.
