
On Aug 18, 2016, we issued an updated report on Xcel Energy Inc. (NYSE:XEL) .Rising debt levels and operational risks are headwinds for Xcel Energy. However, the company’s long-term investment plans will strengthen operations and help serve its expanding customer base more reliably and efficiently.
Recently, Xcel Energy reported second-quarter 2016 operating earnings of 39 cents per share, lagging the Zacks Consensus Estimate of 41 cents by 4.9%. However, reported earnings were on par with the year-ago quarter figure. Meanwhile, Xcel Energy’s second-quarter revenues of $2,499.8 million lagged the Zacks Consensus Estimate of $2,530 million by 1.2% and also declined marginally from the prior-year quarter level of $2,515.1 million.
The company’s long-term debt has witnessed consistent growth from the 2011 level of $8.8 billion to the second-quarter 2016 tally of $13.1 billion. Rising debt levels translate into higher interest cost burden, which eats into the company’s margins. Xcel Energy’s debt/capital ratio stands at 55%, compared to the industry average of 49.8% and the S&P 500 level of 41.9%. Note that the higher the debt relative to its capital, the higher the financial leverage and risk of default.
Compliance with stringent environmental regulations hampers Xcel Energy’s cash flows. Even though the company is gradually shifting to alternative energy sources, coal remains a primary fuel for power generation. The company generated 43% of its total electricity from coal-fired plants in 2015. The U.S. Environmental Protection Agency’s (EPA) finalized Clean Power Plan requires carbon emissions from the power sector to be reduced by 32% by 2030 from 2005 levels. To meet the new emission standards, Xcel Energy will have to invest substantially in pollution control measures at its power generation facilities.
Nevertheless, signs of economic improvement are prominent across Xcel Energy’s service territories, especially in Minnesota, in comparison to the entire nation. The consolidated unemployment rate at the company’s service territory was 3.4% in June, below the national average of 4.9%.The company witnessed customer additions of 1% in the second quarter. Market optimism continues to drive the company’s performance.
Zacks Rank and Key Picks
Xcel Energy carries a Zacks Rank #4 (Sell). Some better-ranked stocks in the utility space are Korea Electric Power Corp. (NYSE:KEP) , Spark Energy, Inc. (NASDAQ:SPKE) and DTE Energy Company (NYSE:DTE) . Both Korea Electric and Spark Energy sport a Zacks Rank #1 (Strong Buy), while DTE Energy is a Zacks Rank #2 (Buy) stock.
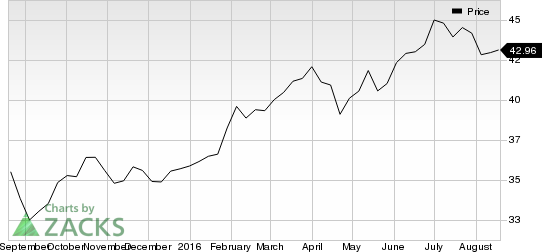
XCEL ENERGY INC (XEL): Free Stock Analysis Report
KOREA ELEC PWR (KEP): Free Stock Analysis Report
DTE ENERGY CO (DTE): Free Stock Analysis Report
SPARK ENERGY (SPKE): Free Stock Analysis Report
Original post
Zacks Investment Research