After its stellar performance last week, gold might do something it hasn’t done since 2012—that is, end the year in positive territory. You can see past returns for yourself in our perennially popular Periodic Table of Commodities Return.
Responding to a weaker U.S. dollar, continued contraction in global growth and wide speculation that interest rates will stay near-zero for the remainder of the year, the yellow metal broke above its 200-day moving average and is close to erasing its 2015 losses.
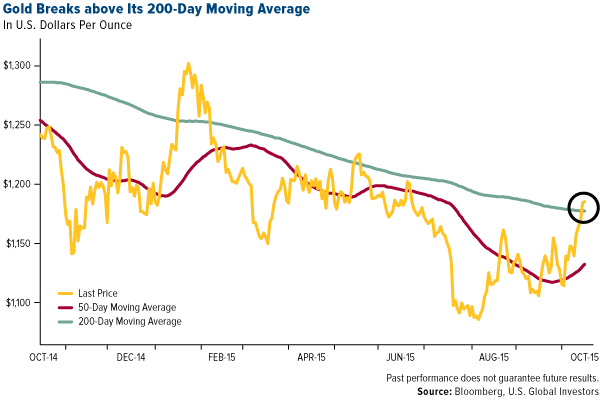
This could be the price reversal many gold bulls have been expecting.
Back in August I shared with you that legendary hedge fund manager Stanley Druckenmiller, who’s made some mythic calls over his long career, invested $323 million of his own money in gold, now the largest position in his family funds. Although such a large weighting isn’t appropriate for all investors—I’ve always recommended 10 percent in gold: 5 percent in gold stocks, 5 percent in bullion—it looks as if Druckenmiller made another good call.
The big news last week was that Walmart (N:WMT) took a massive hit after the retail giant said it expected a profit slump in 2016. Walmart investors lost a whopping $24 billion—$21 billion on Wednesday alone. While this news dominated the headlines, it’s important to recognize that the total amount of net assets in the SPDR Gold Trust (N:GLD), the world’s largest gold-backed ETF, is just slightly more than Walmart’s one-week loss.

“Death” of the Dollar?
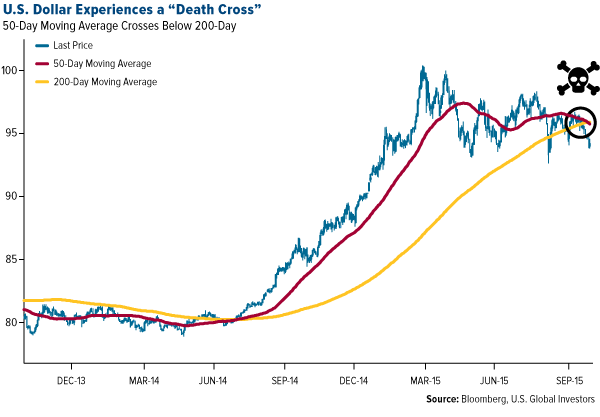
It’s no mere coincidence that gold’s breakout coincides with the weakening of the U.S. dollar last week. The greenback signaled what’s known as a “death cross,” just in time for Halloween. Widely recognized as the start of a bearish trend, a death cross occurs when the 50-day moving average crosses below the 200-day.
This hasn’t happened since September 2013.
As ominous as this sounds, it’s good news for gold and other metals and commodities, not to mention emerging markets and American exports. For the past year, the strong dollar has crushed these assets, something I write and speak about frequently. If the death cross does indeed indicate the start of a downward trend, gold might have the breathing room it needs to reach the important $1,200 resistance level.
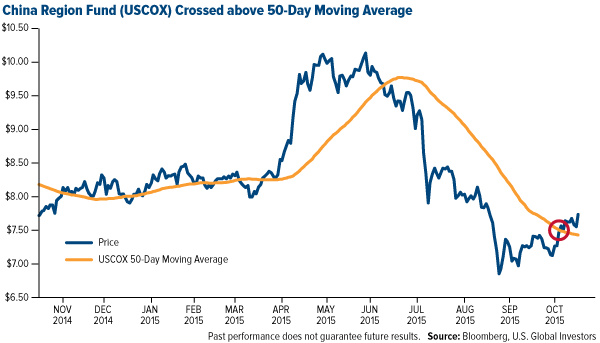
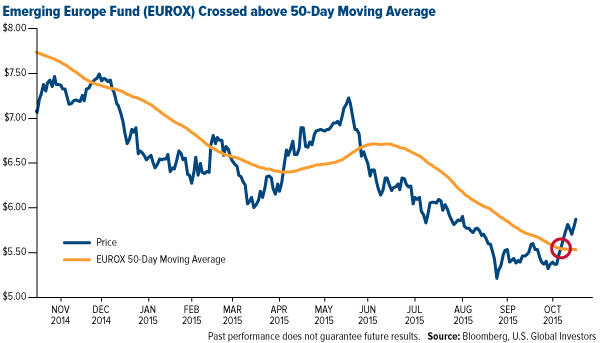
Our China Region Fund (USCOX) and Emerging Europe Fund (EUROX) have responded well to the dollar’s drop, both of them crossing above their 50-day moving averages.
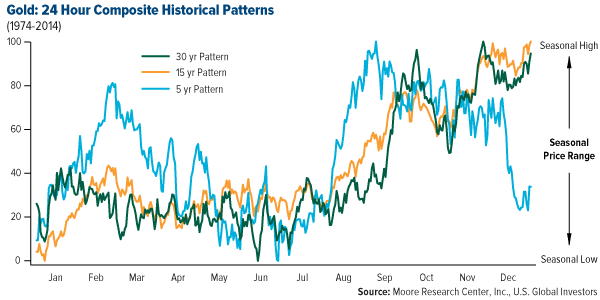
When we factor in the Love Trade, gold has even further upside potential. In India, the world’s largest consumer of the precious metal, the annual wedding and fall festival season has officially begun, which has historically triggered a spike in demand. This period is followed by Christmas and the Chinese New Year in February, when gold prices have surged, based on the shorter-term, five-year pattern.
Russian Air Strikes Ignite the Fear Trade
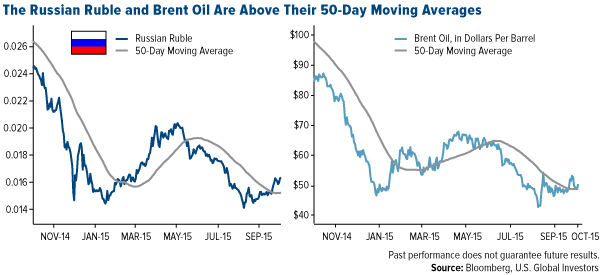
Gold has also likely benefited in the short term by the Fear Trade, specifically global geopolitical events such as Russia’s involvement in Syria. We should never welcome war, but the truth is that political turmoil very often has had a positive effect on commodity prices and currencies. Both the Russian ruble and Brent oil are currently above their 50-day moving averages.
In a recent piece titled “The New Cold War Battlefield… and How It Will Affect Oil Prices,” Dr. Kent Moors, global energy strategist for “Oil & Energy Investor,” writes that what happens in the Middle East has “always had a rather direct impact on energy prices and the prospects for investing in the sector.” 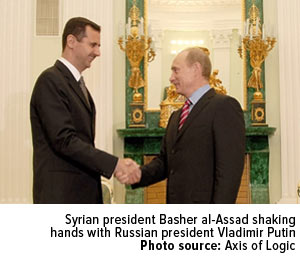
The difference today, Moors says, is that Syria “is a rising power vacuum right smack in the middle of the largest concentration of global crude production.”
Real Interest Rates, Real Impact on Gold
The Fear Trade also includes monetary and fiscal policies such as money supply and real interest rates. As opposed to geopolitical events, which might have an immediate effect on gold, these drivers can have a long-term influence.
As a reminder, real interest rates are what you get when you deduct the rate of inflation from the 10-year Treasury yield. For example, if Treasury yields were at 2 percent and inflation was also at 2 percent, you wouldn’t really be earning anything. But if inflation was at 3 percent, you’d be experiencing a negative real rate.
When gold hit its all-time high of $1,900 per ounce in August 2011, real interest rates were sitting at -3 percent. In other words, if you bought the 10-year, you essentially lost 3 percent a year on your “safe” Treasury investment. Since gold doesn’t cost anything to hold, it became more attractive and the metal’s price soared.
Today, the U.S. has virtually no inflation, so real interest rates are at 2 percent, a swing of 500 basis points since August 2011. This has lately had a negative effect on gold, which means it’s even more remarkable that the precious metal has broken above its 200-day moving average.
Our office was visited last week by Barry Bannister, CFA, the chief equity strategist for investment firm Stifel (N:SF), who gave us buckets of useful macroeconomic research, much of which validated what we’ve been saying for a long time regarding the relationship between the price of gold and real interest rates.
Barry made the case that real interest rates are even higher than we realize. He argued that the reason the Federal Reserve hasn’t allowed rates to lift off yet is because—you might want to sit down for this—it already has, in an “invisible” interest rate hike of 4 percent. Quantitative easing (QE), Barry said, was “negative” interest rates, and that “economic recovery and time ‘raised’ rates to 0 percent, a de facto rate hike.”
Gold’s rally last week occurred in spite of this “invisible” rate hike.
Active Management on Top
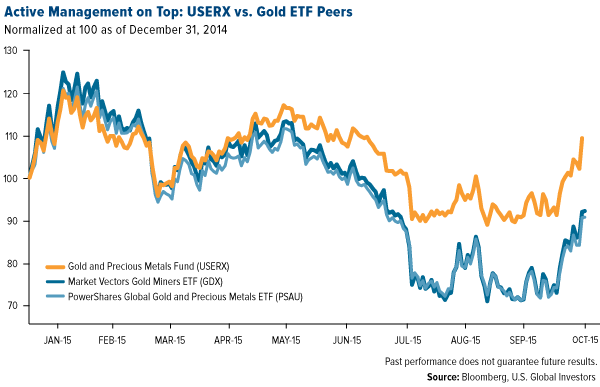
Even with gold prices off around 38 percent since the August 2011 high, our Gold and Precious Metals Fund (USERX) has done well, outperforming the Market Vectors Gold Miners ETF (N:GDX) and PowerShares Global Gold & Precious Metals ETF (O:PSAU).
Both the GDX and the PSAU are strictly market capitalization-weighted, so they might miss out on unexpected “success stories.”
“They end up owning the biggest companies, which because of their size have difficulty growing,” Ralph told IBD.
Klondex Mines(OTC:KLNDF) is one such success story. It’s the fund’s top weighting, at 17 percent—and yet because of its market-cap, it isn’t included at all in the two ETFs.
As Ralph told The Gold Report last week, “I want to own companies where management can increase the value proposition,” regardless of gold prices.
Please consider carefully a fund’s investment objectives, risks, charges and expenses. For this and other important information, obtain a fund prospectus by visiting www.usfunds.com or by calling 1-800-US-FUNDS (1-800-873-8637). Read it carefully before investing. Distributed by U.S. Global Brokerage, Inc.
Past performance does not guarantee future results.
Total Annualized Returns as of 9/30/2015: Fund Year to Date One-Year Five-Year Ten-Year Gross Expense Ratio Expense Cap Emerging Europe Fund (EUROX) 17.84% -26.10% -10.43% -4.65% 2.29% N/A China Region Fund (USCOX) -11.46% -6.68% -4.78% 2.53% 2.97% 2.55% Gold and Precious Metals Fund (USERX) -6.98% -21.82% -20.11% -1.79% 1.97% 1.90% Market Vectors Gold Miners ETF (GDX) -25.39% -35.31% -23.97% N/A 0.53% N/A SPDR Gold Shares ETF (N:GLD) -7.39% -8.79% -3.53% N/A 0.40% N/A PowerShares Global Gold & Precious Metals Portfolio ETF (PSAU) -26.26% -34.84% -22.62% N/A 0.75% N/A
Expense ratios as stated in the most recent prospectus. The expense cap is a voluntary limit on total fund operating expenses (exclusive of any acquired fund fees and expenses, performance fees, extraordinary expenses, taxes, brokerage commissions and interest) that U.S. Global Investors, Inc. can modify or terminate at any time, which may lower a fund’s yield or return. Performance data quoted above is historical. Past performance is no guarantee of future results. Results reflect the reinvestment of dividends and other earnings. For a portion of periods, the fund had expense limitations, without which returns would have been lower. Current performance may be higher or lower than the performance data quoted. The principal value and investment return of an investment will fluctuate so that your shares, when redeemed, may be worth more or less than their original cost. Performance does not include the effect of any direct fees described in the fund’s prospectus (e.g., short-term trading fees of 0.05%) which, if applicable, would lower your total returns. Performance quoted for periods of one year or less is cumulative and not annualized.
For information regarding the investment objectives, strategies, liquidity, risks, expenses and fees of the Market Vectors Gold Miners ETF, SPDR Gold Shares ETF, or the Powershares Global Gold & Precious Metals Portfolio please refer to those funds’ prospectuses.
Investment Objective: The Gold and Precious Metals Fund is an actively managed mutual fund that focuses on gold and precious metals producing companies. The Market Vectors Gold Miners ETF is a passively managed fund that seeks to replicate as closely as possible, before fees and expenses, the price and yield performance of the NYSE Arca Gold Miners Index. The investment objective of the SPDR Gold Trust is for the shares to reflect the performance of the price of gold bullion, less the expenses of the Trust’s operations. The PowerShares Global Gold & Precious Metals ETF is a passively managed fund that seeks to replicate as closely as possible, before fees and expense, the price and yield performance of the NASDAQ OMX Global Gold and Precious Metals Index.
Liquidity: The Gold and Precious Metals Fund can be purchased or sold at a net asset value (NAV) determined at the end of each trading day. The Market Vectors Gold Miners ETF, SPDR Gold Shares ETF and Powershares Global Gold & Precious Metals Portfolio can be purchased or sold intraday. These purchases and redemptions may generate brokerage commissions and other charges not reflected in the ETF’s published expense ratio.
Safety/Fluctuations of principal/return: Loss of money is a risk of investing in the Gold and Precious Metals Fund, the Market Vectors Gold Miners ETF, the SPDR Gold Shares ETF and the Powershares Global Gold & Precious Metals Portfolio. Shares of all of these securities are subject to sudden fluctuations in value.
Tax features: The Gold and Precious Metals Fund may make distributions that may be taxed as ordinary income or capital gains. Mutual funds are pass-through entities, so the shareholder is responsible for taxes due on distributions.
The Market Vectors Gold Miners ETF and the Powershares Global Gold & Precious Metals Portfolio may make distributions that are expected to be taxed as ordinary income or capital gains. However, ETFs are designed to minimize taxable distributions to shareholders. Shareholders of the SPDR Gold Trust will generally be treated as if they directly owned a pro rata share of the underlying assets held in the Trust. Shareholders also will be treated as if they directly received their respective pro rata shares of the Trust’s income and proceeds, and directly incurred their pro rata share of the Trust’s expenses.
The sale of shares of both mutual funds and ETFs may be subject to capital gains taxes by the shareholder.
Information provided here is neither tax nor legal advice and is general in nature. Federal and state laws and regulations are subject to change.
Foreign and emerging market investing involves special risks such as currency fluctuation and less public disclosure, as well as economic and political risk. By investing in a specific geographic region, a regional fund’s returns and share price may be more volatile than those of a less concentrated portfolio. The Emerging Europe Fund invests more than 25% of its investments in companies principally engaged in the oil & gas or banking industries. The risk of concentrating investments in this group of industries will make the fund more susceptible to risk in these industries than funds which do not concentrate their investments in an industry and may make the fund’s performance more volatile.
Gold, precious metals, and precious minerals funds may be susceptible to adverse economic, political or regulatory developments due to concentrating in a single theme. The prices of gold, precious metals, and precious minerals are subject to substantial price fluctuations over short periods of time and may be affected by unpredicted international monetary and political policies. We suggest investing no more than 5% to 10% of your portfolio in these sectors.
Fund portfolios are actively managed, and holdings may change daily. Holdings are reported as of the most recent quarter-end. Holdings in the China Region Fund, Emerging Europe Fund and Gold and Precious Metals Fund as a percentage of net assets as of 9/30/2015: Wal-Mart Stores Inc. (N:WMT) 0.00%, SPDR Gold Shares ETF 0.00%, Market Vectors Gold Miners (N:GDX) ETF 0.00%, PowerShares Global Gold & Precious Metals Portfolio ETF 0.00%, Klondex Mines Ltd. in Gold and Precious Metals Fund 16.91%, Concordia Resource Corp. 0.00%, Ivanhoe Mines Ltd. (OTC:IVPAF) 0.00%.
All opinions expressed and data provided are subject to change without notice. Some of these opinions may not be appropriate to every investor. By clicking the link(s) above, you will be directed to a third-party website(s). U.S. Global Investors does not endorse all information supplied by this/these website(s) and is not responsible for its/their content.

