
The most recent recovery in the natural gas futures market took the price of August futures from a low of $1.517 on June 25 and 26 to a high of $1.924 per MMBtu on July 7. The now-expired July contract traded down to a new 25-year low at $1.432 in late June. The double bottom formation on the daily chart now stands as technical support with the July 7 high as resistance.
August futures have been working their way lower since trading at $1.924. Last week, the price was below the $1.65 per MMBtu level and under the midpoint of its recent trading range.
Over the past weeks, the level of injections into storage across the United States has been dropping. The last triple build in inventories came during the week of June 19 when they rose by 120 billion cubic feet. The following week, they increased by 65 bcf, and by 56 for the week ending on July 3. The stockpiles only increased by 45 bcf for the week ending on July 10. On Thursday, July 23, the Energy Information Administration reported stock data for the week ending on July 17. The United States Natural Gas Fund (NYSE:UNG) is the ETF product that follows the NYMEX natural gas futures price higher and lower.
The market expected the fourth consecutive lower build of 38 bcf.
According to Estimize, a crowdsourcing website, the market consensus for the weekly inventory report from the EIA for the week ending on July 17 was for a continuation of the trend since June 19 and an injection of 38 billion cubic feet of natural gas into storage.
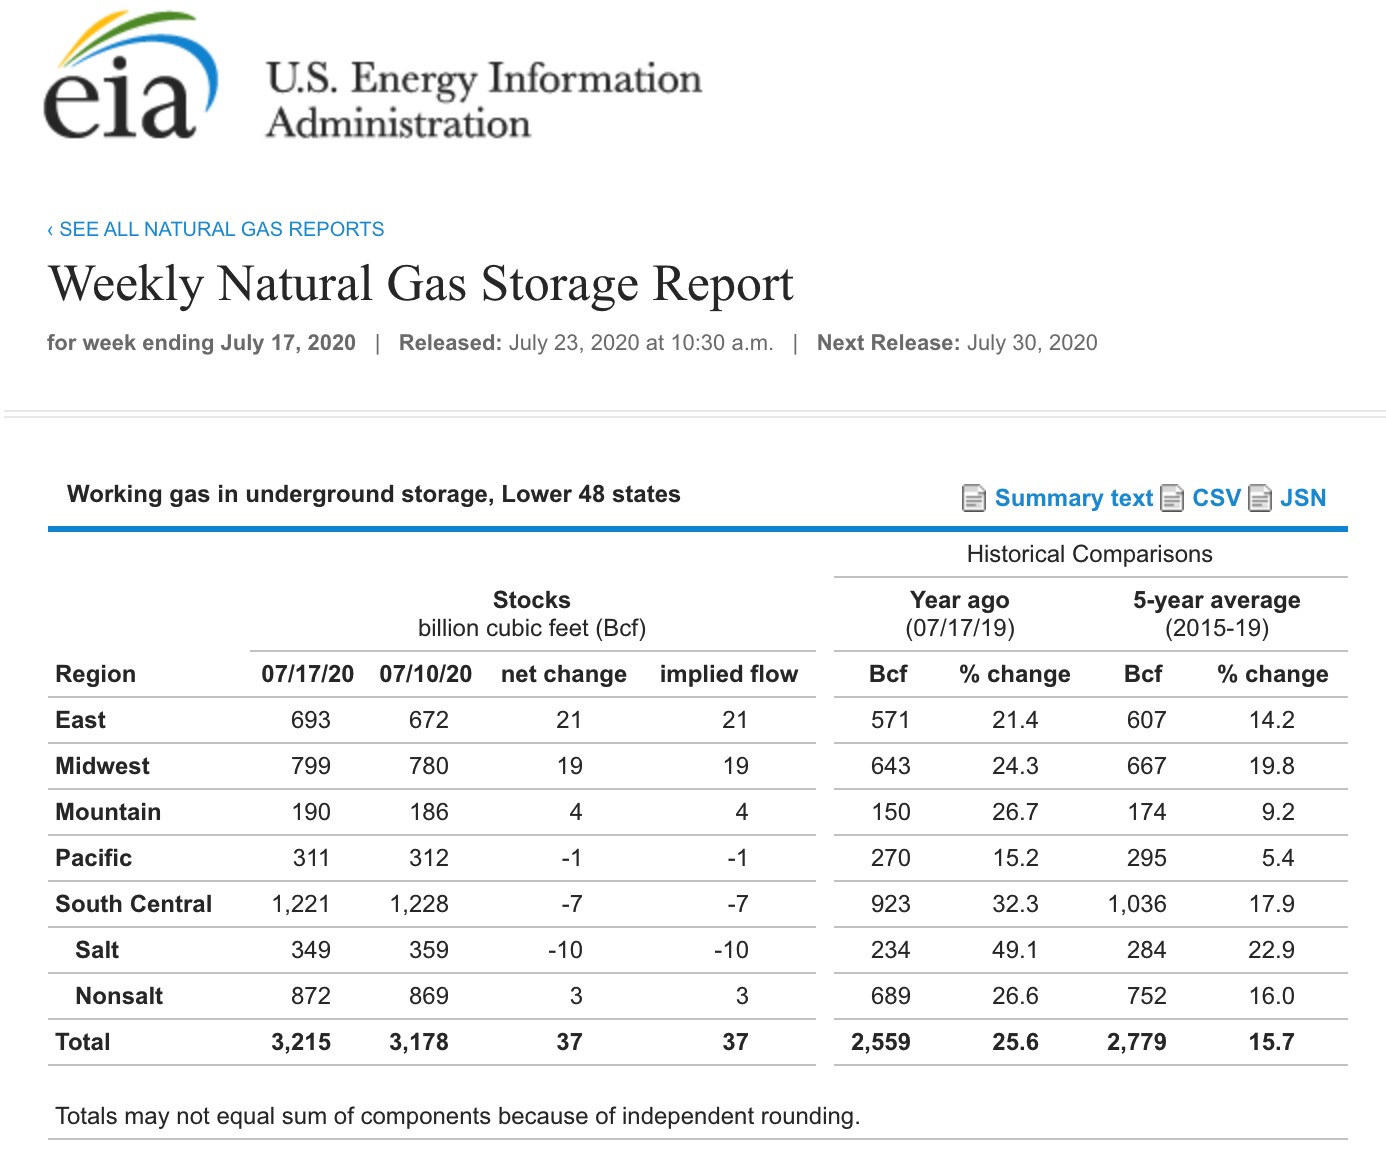
Source: EIA
As the chart highlights, the inventory build came in just one bcf below expectations at 37 bcf. Stocks rose to a total of 3.215 trillion cubic feet, 25.6% above last year’s level, and 15.7% over the five-year average for this time of the year. It was the 17th consecutive week where the percentage above the previous year declined in a sign of falling output. According to Baker Hughes, on July 17, there were a total of 71 natural gas rigs operating compared with 174 in mid-July 2019.
August Futures Are Consolidating
On the most recent decline from $1.924 per MMBtu on July 7, natural gas fell to a low of $1.605.

Source: CQG
The daily chart shows that the price was just below the $1.74 level on July 23, which was the third straight session of higher prices. Natural gas is consolidating at just below the midpoint of the trading range from $1.605 to $1.924 in July. Relative strength moved higher to a neutral reading, but price momentum remains at near an oversold condition. Open interest has been steady at the 1.306-million-contract level. Daily historical volatility declined from over 82% on July 9 to around 45.5% on July 23. The price consolidation is a healthy sign for the natural gas market. Short-term technical support is at $1.605 per MMBtu.
Moving Out Of Summer Season In A Few Short Weeks
With August just around the corner, the natural gas market will soon begin to shift its focus to the coming winter withdrawal season when inventories start to decline in November. However, with total stocks at 3.215 tcf, the potential for a rise to over the four trillion cubic feet level for the third time in modern history is high. The level of stockpiles could prevent the price from moving appreciably higher, but seasonality, declining output, and the low price level are likely to put upward pressure on the price of the energy commodity.
I remain cautiously bullish on the price of natural gas at below the $1.75 per MMBtu level. Futures markets reflect seasonality, and natural gas is preparing to leave the summer season in its rearview mirror.