It has been a while since we’ve applied historical analysis to the precious metals sector. It is something we really enjoy as history can help define and contextualize current trends and help us spot opportunities.
Back in March of this year we noted that the gold stocks could be following the path of recovery of housing stocks since their 2009 bottom. Recently, James Flanagan of Gann Global Financial has produced some excellent videos discussing some historical comparisons that are quite relevant to the gold stocks at present.
We saw his videos, remembered our housing analog and wanted to take it a step further. What was the path of recovery of markets following mega bear markets?
We define a mega bear market as at least an 80% decline that lasted roughly three to four years. The image below highlights the data we’ve compiled. Some of the bears are only two years long but they follow the general recovery path. That consists of a very strong initial rebound that lasts six to twelve months which is followed by a correction and consolidation which usually lasts 18 months to two years. Then, the market begins its next impulsive advance.
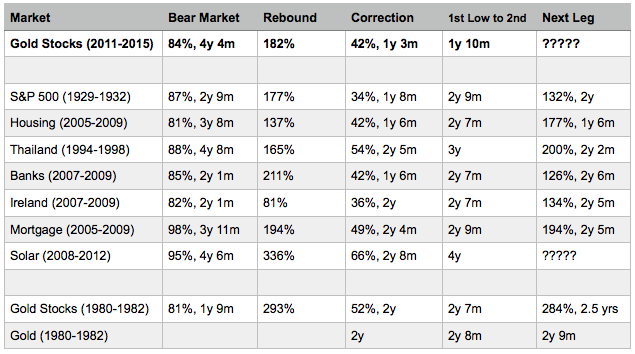
Next we will look at the three best fits to the gold stocks at present.
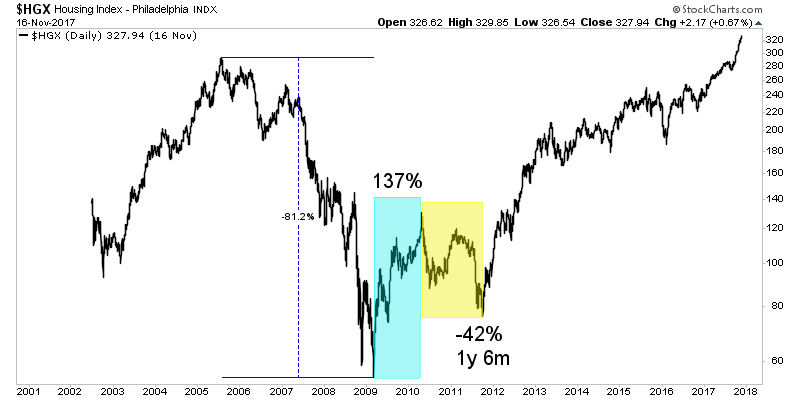
The housing stocks may be the best analog. They lost 81% during a bear market which lasted nearly four years. Then they recovered 137% before correcting 42% over 18 months. Over the next 18 months (from the 2011 low to 2013), the housing stocks gained 177% (via HGX).
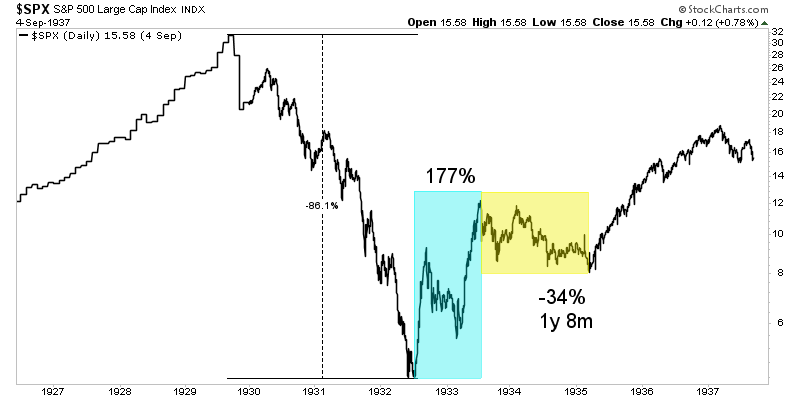
The S&P 500 during the Great Depression is also a good fit. The market lost 86% over nearly three years. That led to a 177% rebound which was followed by a 34% correction over one year and eight months. The market then rebounded 132% over the next two years.
Finally, Thailand via the Bangkok SET Index is an interesting example. It lost 87% over a greater than four year bear market. Both time and price were similar to the bear market in gold stocks. After rebounding 142%, Thai stocks lost 54% over the next year and four months.
While that low in late 2000 marked the corrective low in price, the market did not begin an impulsive advance for another year. However, it was worth the wait as the market gained 200% over the following two years.
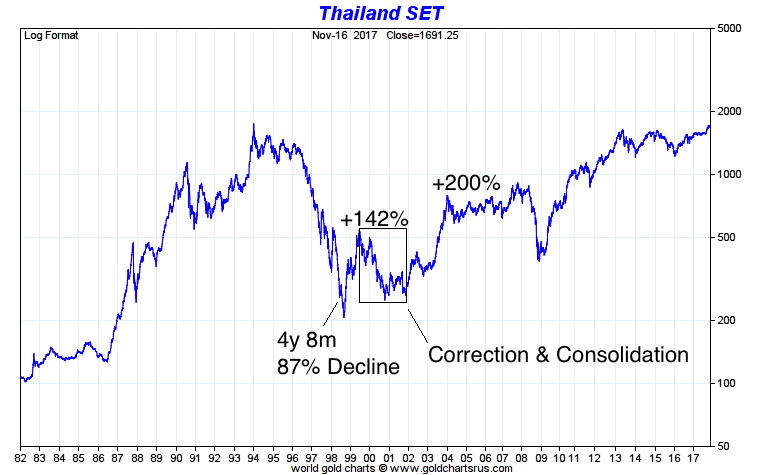
The gold stocks have followed the recovery path of these markets but there are some slight differences. The corrections and consolidations in Housing and the S&P 500 were less severe as those markets tested—or at least came close to testing—their initial rebound peaks. The correction in Thailand was more severe as that market shed 54% in 16 months.
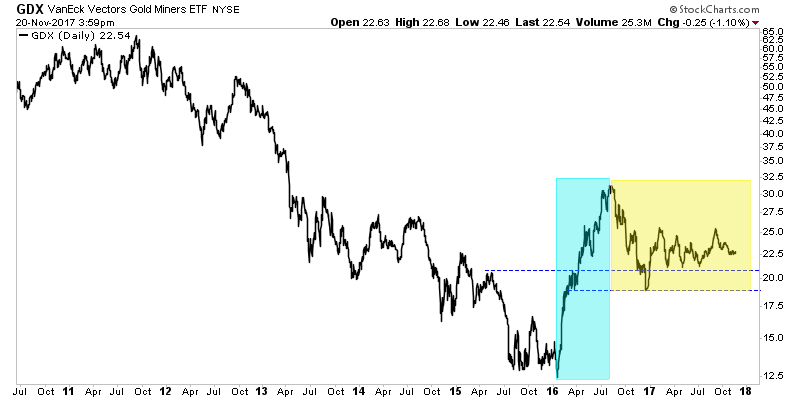
At present, gold stocks (via VanEck Vectors Gold Miners (NYSE:GDX)) are in the 16th month of their correction and are down roughly 30%-35%. In any case, we expect the current correction and consolidation to continue into 2018.
There is no guarantee of a future breakout move in precious metals, but the gold stocks are following a specific history of recoveries following mega bear markets and that history implies a major move higher should begin sometime in 2018. When we consider the time of the corrections and time between the two bottoms, along with the slight weakness in gold stocks as compared to some of the examples, we expect the next significant low to be in Q2 or Q3 2018.
The low does not necessarily have to be an absolute price low. It would mark the point from which the gold stocks would begin an impulsive advance. In the meantime, the key for traders and investors is to find the best companies and seek oversold situations with value and catalysts that will drive buying.

