Summary: All of the US equity indices made new all-time highs again this past week. Treasuries were the biggest winner. A drawdown of at least 5-8% in SPX is odds-on before year year end, but there are a number of compelling studies suggesting that 2017 will probably continue to be a good year for US equities.
On Friday, SPX and DJIA made new all-time highs (ATH). During the week, COMPQ, NDX, RUT and NYSE also made new ATHs. All the indices moving to new highs together suggests that this is a broadly based rally. The trend remains up.
For the week, SPX and DJIA gained 1%. NDX notched a 0.4% gain and RUT closed lower. The biggest gain came from Treasuries, with iShares 20+ Year Treasury Bond (NASDAQ:TLT) gaining 1.4%. We continue to like the set up in Treasuries, as explained in detail last week (here).
Little has changed from last week's summary. Instead of repeating those same messages, we'll highlight four new studies that show a favorable longer term outlook for US equities.
First, SPX has now gone 76 days since the last 3% drawdown ended on November 4, right before the US election. That is the longest streak since July 2006 to February 2007, when the SPX went 150 days without a 3% drawdown. The chart below shows the duration and magnitude of the current rally relative to other long streaks in the past 14 years (yellow highlighting equals the current rally).
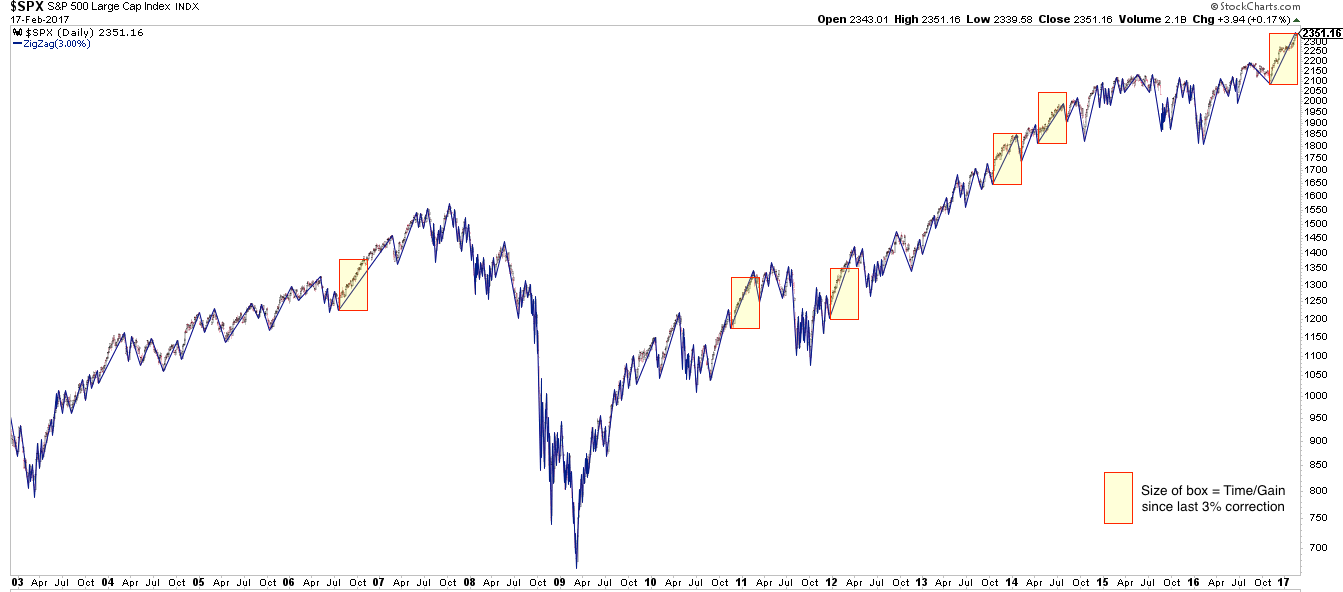
The message from this chart is twofold.
First, the current uninterrupted rally is rare and extended from a historical perspective, but these periods can last much longer.
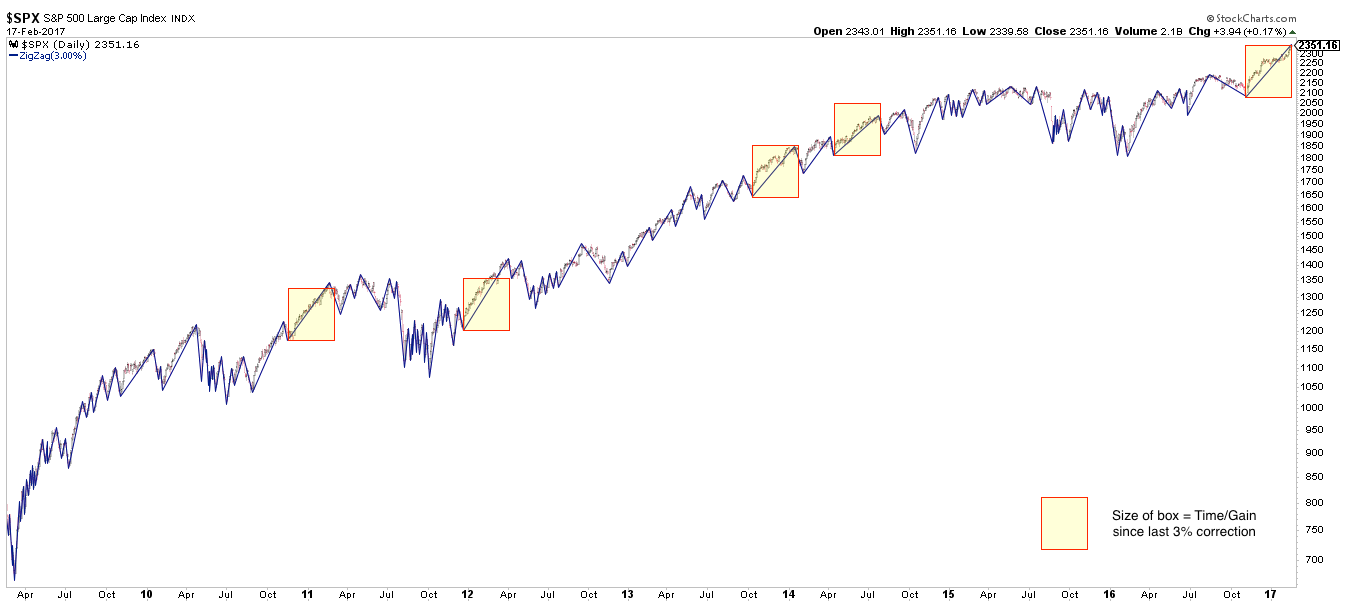
Second, when the current uptrend ends, it is not likely to lead directly into a more significant downturn. Momentum like this weakens before it reverses. In each of the cases highlighted above, after a 3-5% drawdown, SPX either continued higher or retested the prior high before falling lower. Mid-2011, 2012 and 2014 are recent examples of the latter case (shown below). That would be our expectation now as well.
Second, the current rally is perhaps most pronounced in the Dow Industrials. DJIA has closed at new ATHs the past 11 days in a row. The streak has only extended to 12-13 days twice since 1900. Of the 14 similar streaks, the DJIA closed higher after 1 or 3 months 11 times (79%). It also closed higher after 6 or 12 months 11 times. In other words, the upward momentum most often continued in the months following the end of the streak (from Ryan Detrick).
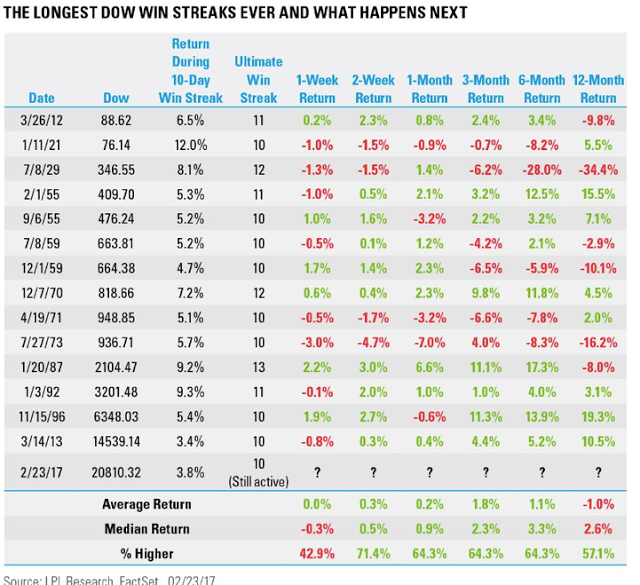
In the chart above, note that the only outright failure was 44 years ago, in 1973. This period coincides with the 1973-74 oil embargo. Within 4 months, the price of crude oil quadrupled, causing the US economy to plummet into the 1973-75 recession. A repeat of that scenario now is not likely.
One of the other long streaks ended in January 1987. In October of that year, the SPX crashed 30%. It was devastating, but note that between the end of the streak in January and the start of the crash in October, SPX rose a further 30%. In other words, the upward momentum lasted another 9 months.
The third long term study relates to seasonality. Specifically, with two trading days left in February, the SPX has risen almost 6% YTD. In the 27 prior instances since 1945 that SPX has been up in both January and February, it has closed up for the full year all 27 times. The average full year gain was 24%; in only 2 cases was full year gain less 10% (from CFRA).
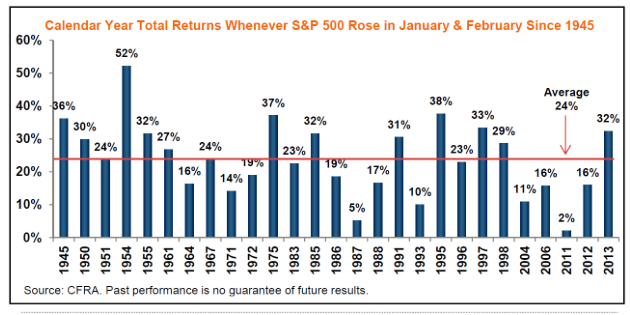
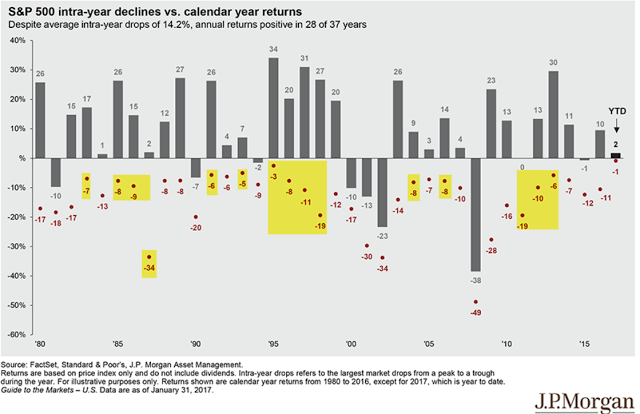
That doesn't mean that the index didn't experience turbulence in the next 10 months. In the 16 occurrences since 1980, SPX had a median intra-year drawdown of 8% (those 16 cases are highlighted in yellow). With the index up 6% YTD, a drawdown of median size could take the SPX into negative territory for the year (from JPM).
What happened if you bought the close on the last day of February and held until year-end? In most cases (14 of 16, or 88%), SPX closed higher, often by more than 10%. But in half the cases, there was an intra-year drawdown of at least 5% and more than 10% in three memorable years (1987, 1998 and 2011; from @Minion_of_Gozer).
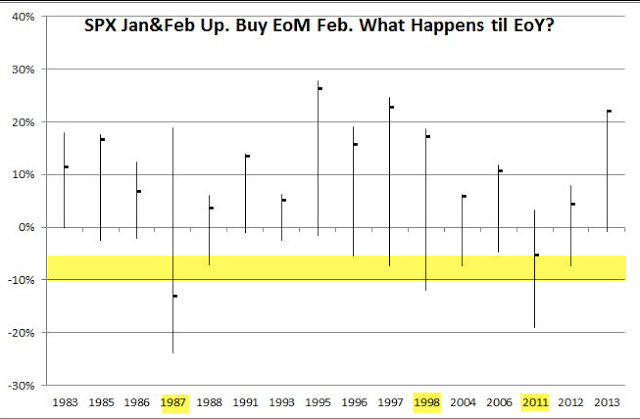
Based on the strong start to the year, returns are likely to be positive through year end but a drawdown of at least 5-8% before then is also odds-on. Buy the dip.
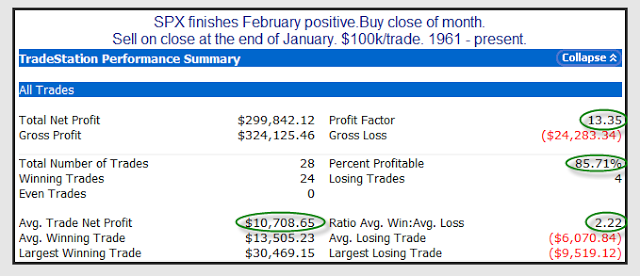
In a related study that examines positive closes in February, the next 11 months saw net gains 86% of the time (24 of 28 years since 1961). The profit factor (gains divided by losses) is 13, which is very attractive (from Rob Hanna).
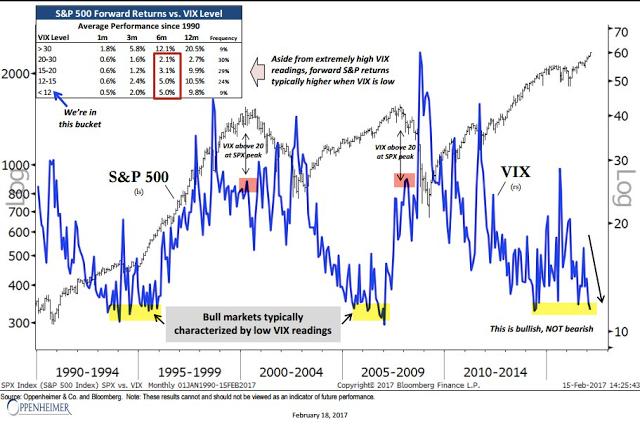
The fourth study with longer term implications relates to volatility. Much has been made of the persistently low level of the VIX. The three most recent bull markets have each been characterized by a persistently low VIX. Historical instances are severely limited, but a low VIX has been a positive sign for the SPX. The market did not peak in either 2000 or 2007 until VIX had climbed, over the course of years, to more than 25. Since 1990, when the VIX has been below 12, SPX has returned 5% and 10% over the next 6 and 12 months, respectively (from Ari Wald).
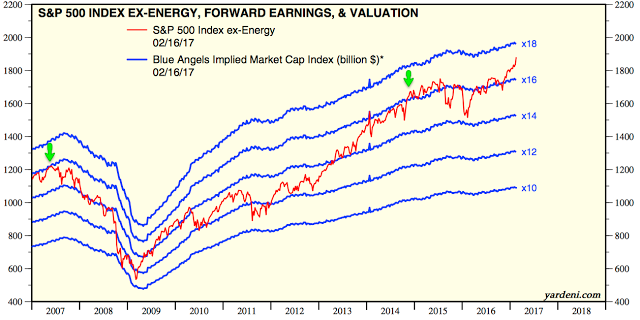
It's true that current market valuations are unattractive, a headwind we have raised when discussing earnings (read further here). But keep in mind that overvaluation has been a very bad mechanism for market timing. The correlation between valuations and forward one-year returns is nearly zero. Investors rightly indicated that the SPX was fully valued in late 2014; since then, it has gained another 25% (from Yardeni).
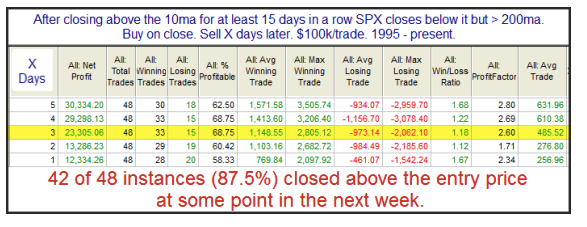
A final note on the current market: SPX has closed above its 5 and 10-dma for 15 days in a row. This is an exceptional period of strength. It can continue longer. Importantly, the first close below these averages is likely to be aggressively bought, something to watch for should the streak end this week (from Rob Hanna).
In summary, there are a number of compelling studies suggesting that 2017 will probably continue to be a good year for US equities. In addition to the four such studies reviewed in this post, add in rebounding equity fund flows and positively trending macro data. All of that said, a drawdown of at least 5-8% in SPX is odds-on before year year end. Our summary last week suggests that drawdown could happen sooner than many investors current believe is likely (read further here).
The calendar is heavy for the week ahead. Durable Goods on Monday; GDP on Tuesday; and Personal Consumption on Wednesday. NFP is the following Friday, March 10.
