
With last weeks minimal coverage, a lot has occurred in the world of contrarian indicators. Let us cover this week's conditions. AAII survey readings came in at 30% bulls and 35% bears. Bullish readings fell by about 7% while bearish readings fell by 5%. The bull ratio (4 week average) currently stands at 46%, sea smack in the middle of the historical range.
Investor Intelligence survey levels came in at 42% bulls and 25% bears. Bullish readings fell by 5%, while bearish readings increased by 3%. Bull ratio has now fallen modestly from the previous "sell signal" readings, and currently sits at 62.5%. It is also worth noting that bullish readings have fallen by over 13% since the correction began in later parts of May. Chart 1: Fund managers have reduced their net long exposure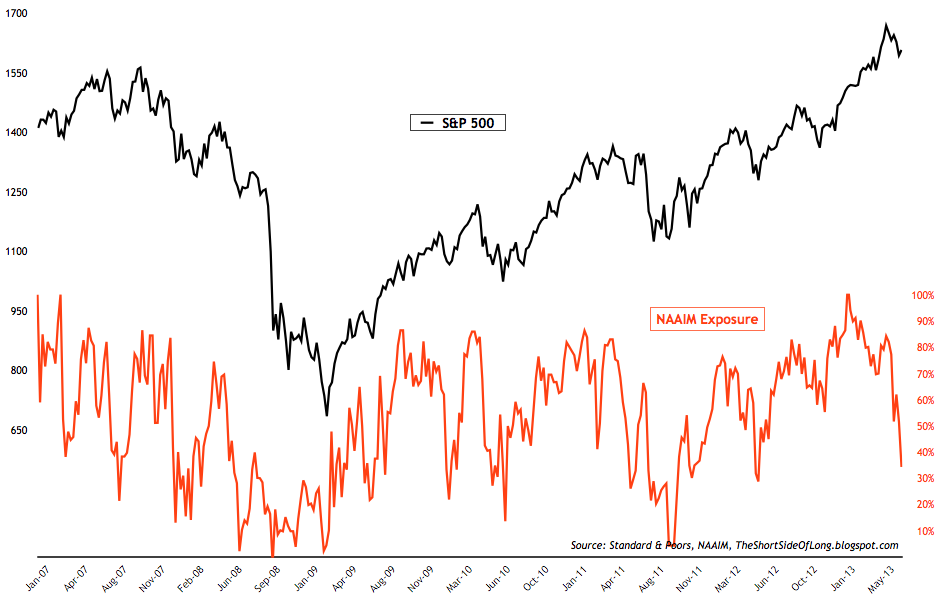
- NAAIM survey levels came in at 34% net long exposure, while the intensity continues to be reduced. It is worth noting that in early parts of 2013, this indicator reached a record high bullish reading and has since mean reverted quite a lot. Intermediate buy signals are usually given when the exposure falls below 20%, while true contrarian buy signals occur as managers turn net short, as seen in late 2008 and late 2011.
- Other sentiment surveys have also started to pull back from recent extremely bullish readings seen through the month of May and June. Consensus Inc survey, Market Vane survey and Hulbert Newsletter Stock Sentiment are all reverting back towards the mean now, however we are nowhere near extreme bearish readings worthy of contrarian "buy signals".
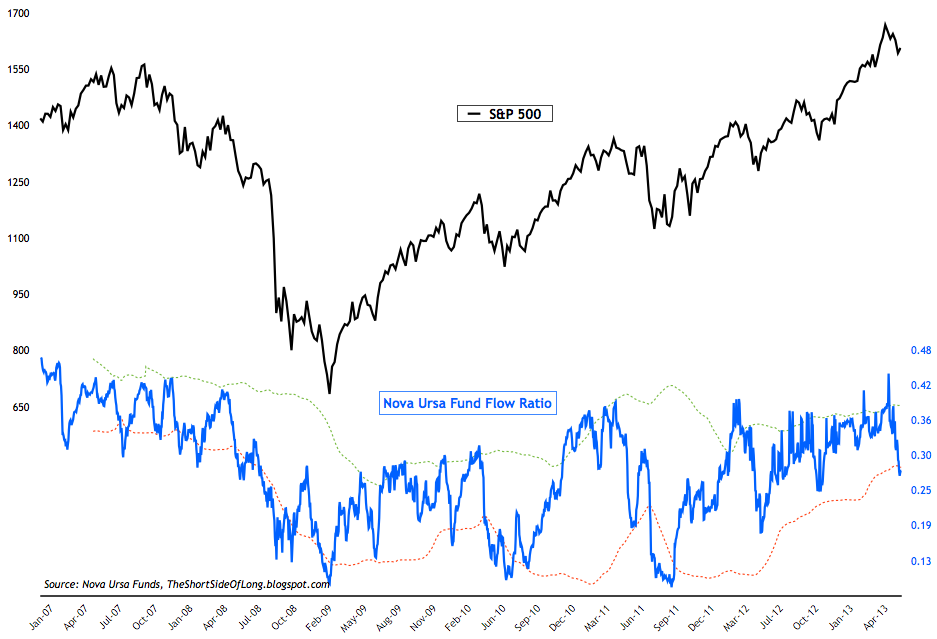
- Rydex fund flows have finally started pulling back from extremely high bullish inflows witnessed only several weeks ago. The Nova Ursa fund flow indicator has fallen to a ratio of 27.5 from the ratio of 45. While the short term buy signal has been triggered in recent days, thanks to the Bollinger bands indicator, I believe that any new market highs will be suspect. A long term buy signal is triggered at much lower levels of pessimism, with the Nova Ursa ratio dropping as low as 10 at times (March 2009, July 2010 and October 2011).
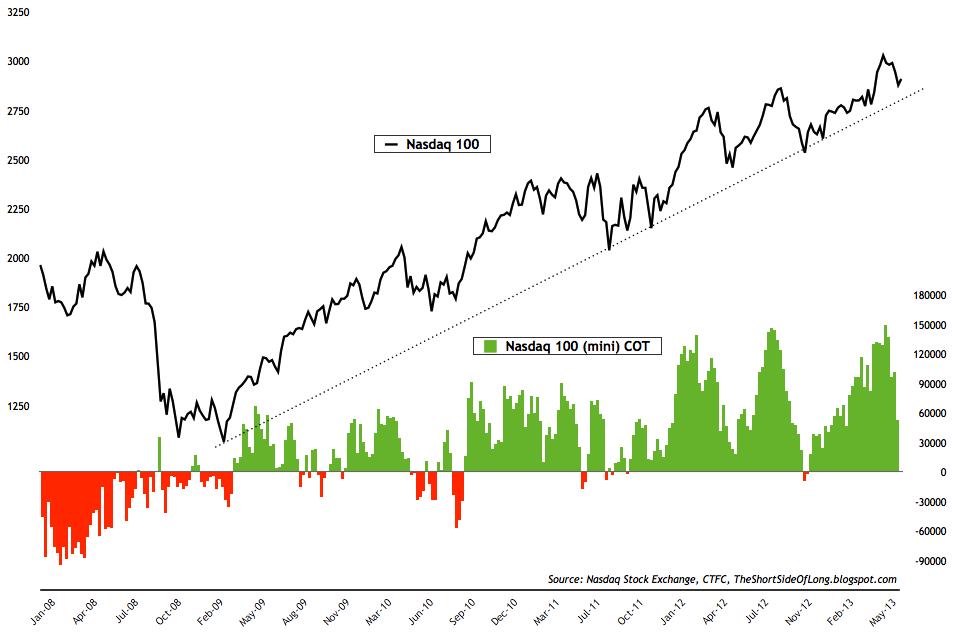
- As already discussed last several weeks, confirming the recent pullback in sentiment surveys, speculator bets reported by commitment of traders showed that hedge funds continue to cut their bullish bets on US technology stocks. While the exposure reached as high as 150,000 net long contracts several weeks ago, we are now coming back to earth as the recent correction shakes out majority of the leveraged players. There are currently less then 55,000 net long contracts on Nasdaq 100 and if prices decline further come fall (August, September & October hold bad seasonal periods for stocks), it should not be surprising to see speculators turn net short.
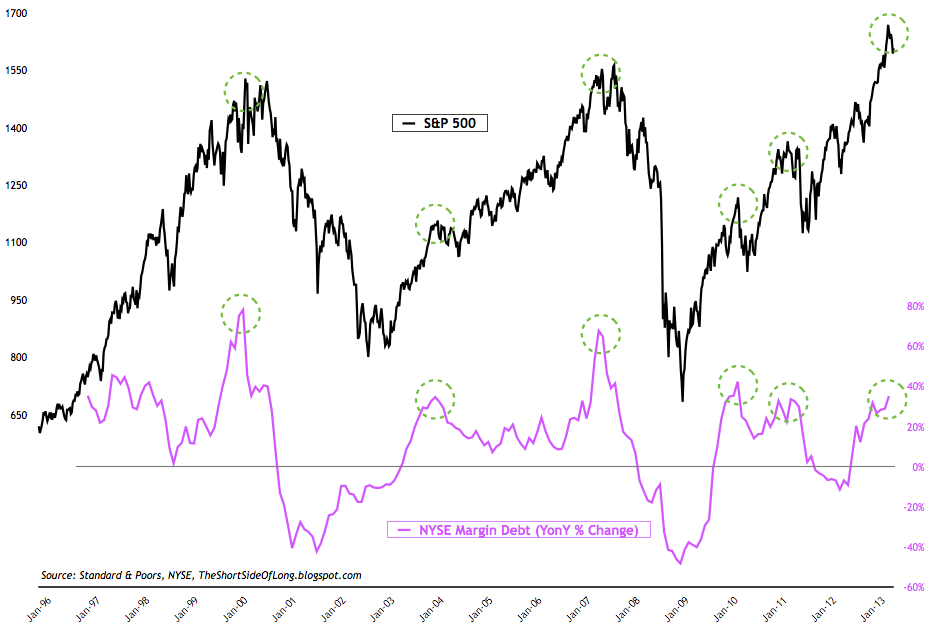
- NYSE margin debt has been slightly reduced in the month of May by only $7 billion, as margin levels fell from $384.3 billion towards $377.0 billion. Interestingly, margin debt still continues to grow when looked at annual basis (year on year), as the readings reach north of 35%. As the chart above clearly shows, previous spikes above 30% have usually marked either indeterminate degree tops or outright bull market peaks. This time around, after an impressive 153% gain from March 09 lows, I'd assume it will be the later rather than the former.
- Bond sentiment surveys are nearing pessimistic territory, but from the indicators I follow, we are not yet at extreme pessimistic levels. Market Vane survey & Hulbert Newsletter Bond survey remaining in the middle of their historical readings, while Consensus Inc survey is approaching extreme downside levels. Treasury Bond prices have been struggling since June 2012, when Draghi announced his famous "whatever it takes" speech, with a series of lower lows and lower highs.
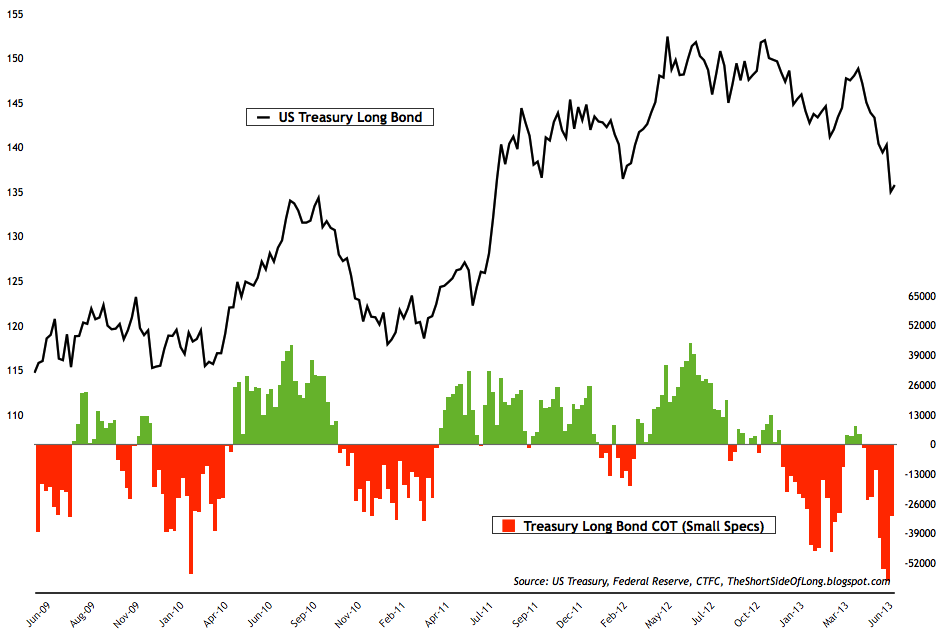
- After last weeks extremely bearish bet total, this weeks commitment of traders report shows that small speculators pulled back on their net short bets in the Treasury Long Bond market. After reaching close to 60,000 net short bets, this week small specs reduced those bearish positions by almost half, as the overall market holds a little bit more then 30,000 net short bets. Recent spike in TLT volume indicates short term selling panic, which is a complete opposite condition when compared to a TLT volume spike in June 2012, during buying frenzy as Treasuries rallied almost vertically.
Chart 6: Hedge funds exposure to commodities sinks to new lows!
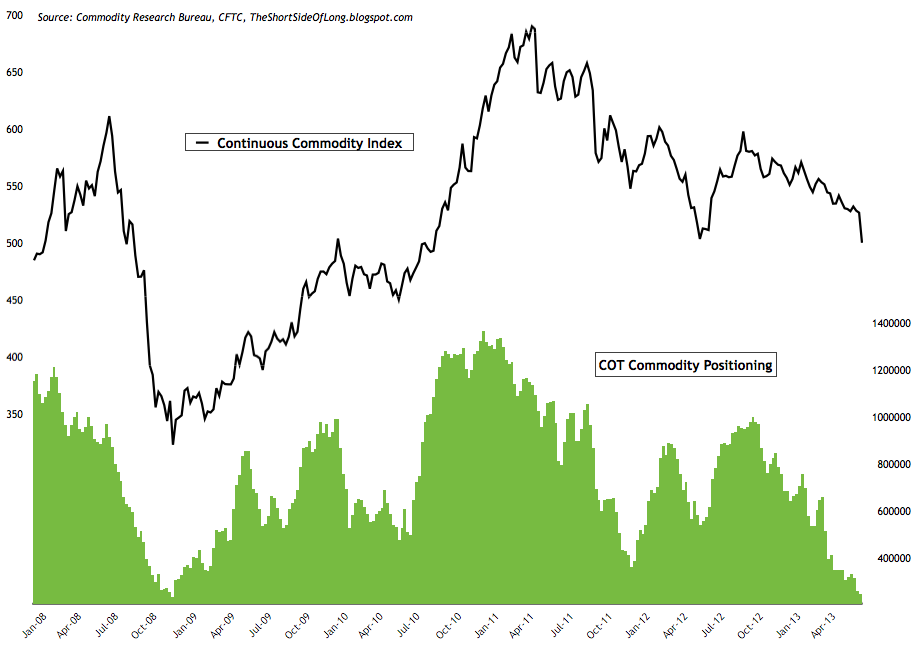
- Latest commodity commitment of traders report showed that hedge funds and other speculators fell to on of the lowest exposures in at leas a decade. Cumulative net long exposure currently stand at 245,000 contracts, which can be very closely compared to 2008 reading low of 233,000 contracts. While agricultural exposure increased (both grains and softs), bullish bets on energy and metals fell this week.
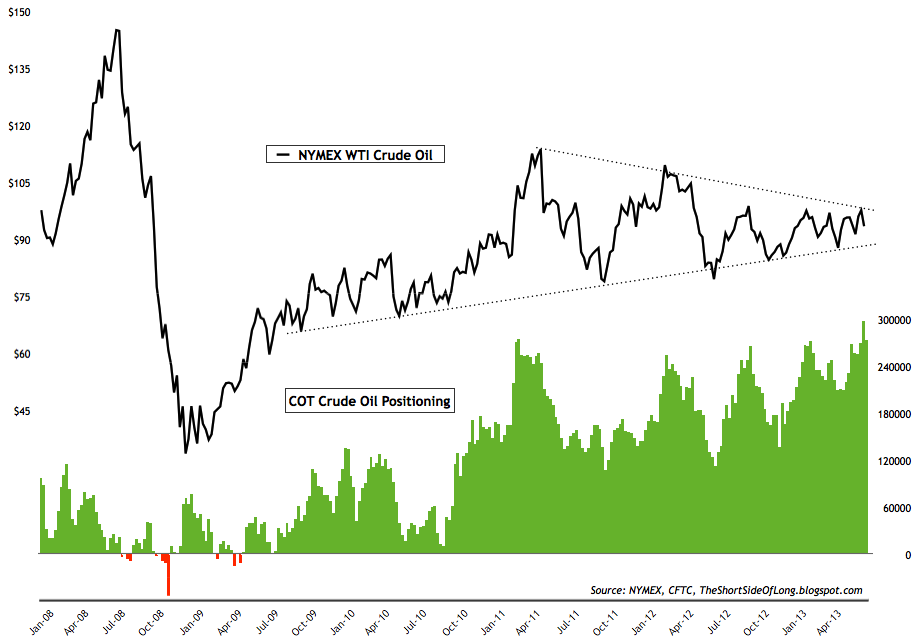
- Technically, Crude Oil remains in a technical triangle consolidation. Since the pattern is more then two years in progress, a break in either direction could set up quite a long trending moving. Hedge funds remain extremely bullish on the price of crude and it should be noted that previously high positioning has almost always resulted in intermediate degree tops.
- Commodity Public Opinion surveys continue to show bearish tendency in quite a few commodities, including the complex as a whole. Investors are currently negative on Gasoline, Copper, Platinum, Cattle, Cocoa, Coffee, Lumber and Wheat. In particular, sentiment on Copper has reached multi year lows, last seen during mega crash in 2008.
Chart 8: Hedge funds continue to cut their bullish exposure towards the buck
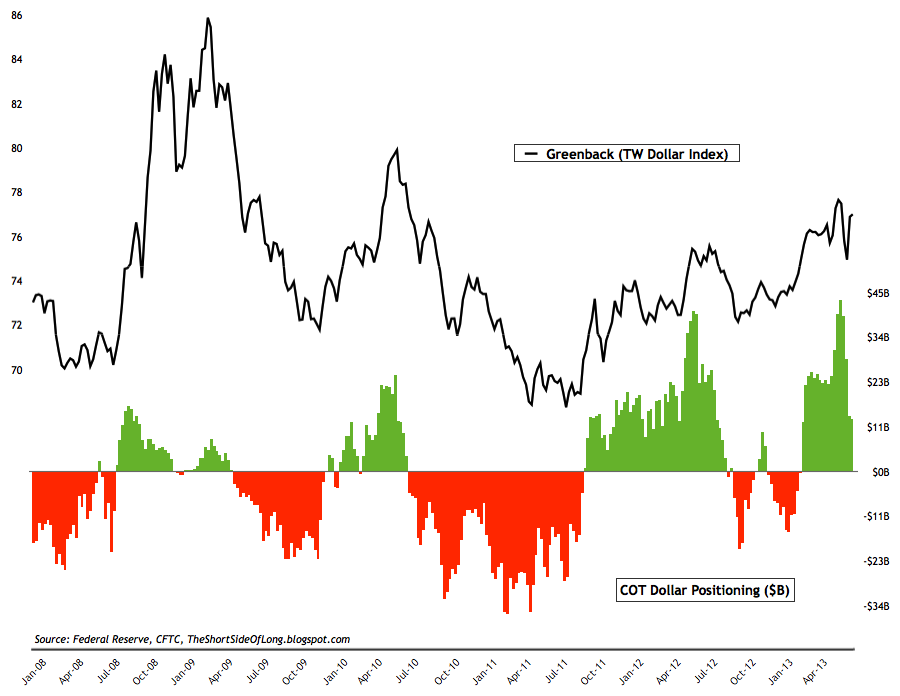
- Latest currency commitment of traders exposure towards the US Dollar remained quite steady this week. Cumulative Dollar positioning now stands just slightly above $13.2 billion, which is similar to last weeks $14 billion, but is a dramatic squaring of bullish bets from $43 billion seen several weeks ago. While the short bets on the Euro and the Franc have been converted to the long side, New Zealand's Kiwi Dollar has entered net short positioning. Aussie Dollar short bets remain near record highs.
- Currency Public Opinion survey readings on the US Dollar have now mean reverted to more neutral levels. At the same time, Public Opinion on the foreign currencies has also risen from extreme negative levels. However, it is worth mentioning that Public Opinion on commodity currencies like Loonie, Kiwi and Aussie is extremely negative.
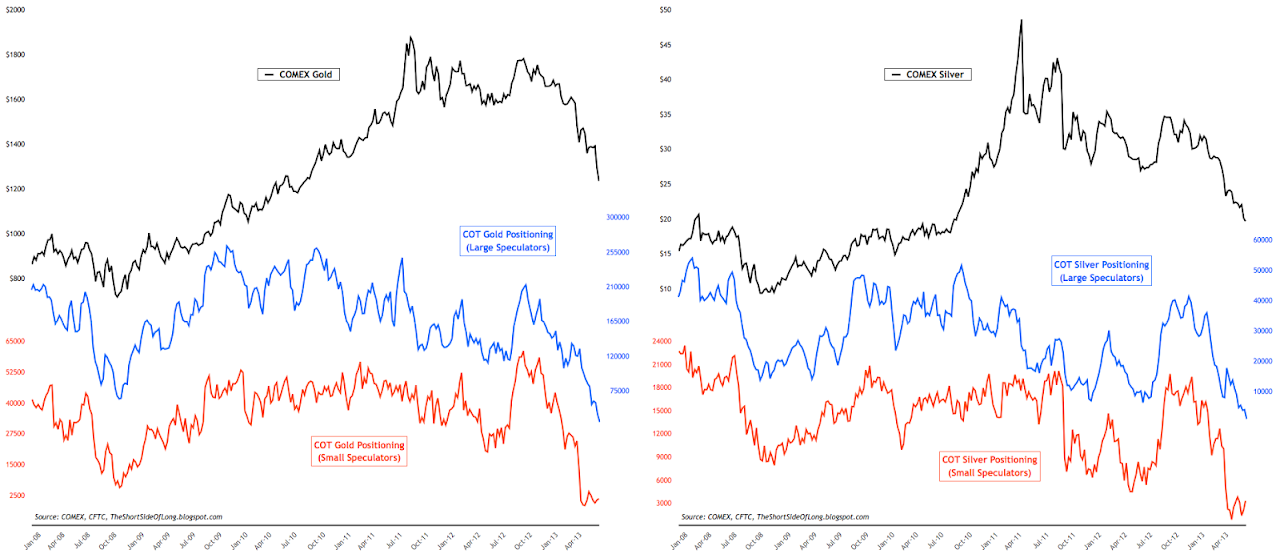
- Alternative currency commitment of traders report showed hedge funds and other speculators still continue to remain extremely underexposed towards the precious metals sector. Hedge fund positions on Gold remain at very low levels of 34,000 net longs (at this rate we will be net short in a few weeks), while in Silver positioning has now reached a record low reading of just 837 net long contracts (hedge funds are close to being net short Silver for the first time in CTFC history). When observed as percentage of open interest, both Gold and Silver net long bets are now in single digits... a pure buy signal!
- Public opinion on alternative currencies like Gold and Silver continues to remains depressed and sinks lower by the week, confirming the COT reports discussed above. Outright bearishness and despair remain the correct phrases to be used when describing this sector... a perfect condition for a contrarian investor.