
Viasat, Inc. (NASDAQ:VSAT) delivered solid fourth-quarter fiscal 2019 results, wherein both revenues and adjusted earnings surpassed the respective Zacks Consensus Estimate, and increased year over year.
Net Income
On a GAAP basis, net income for the quarter was $2.5 million or 4 cents per share against net loss of $19.9 million or loss of 34 cents per share in the year-ago quarter. The year-over-year improvement was primarily driven by higher product and service revenues. For fiscal 2019, net loss was $67.6 million or loss of $1.13 per share compared with net loss of $67.3 million or loss of $1.15 per share in fiscal 2018.
Non-GAAP net income was $20.4 million or 33 cents per share against net loss of $3.1 million or loss of 5 cents per share in the prior-year quarter. The bottom line beat the Zacks Consensus Estimate of loss of 25 cents.
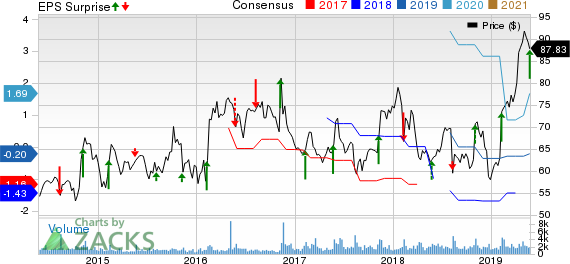
Viasat Inc. Price, Consensus and EPS Surprise
Revenues
Quarterly total revenues increased 26.7% year over year to $557.2 million, primarily driven by double-digit top-line growth in all three operating segments. The top line surpassed the consensus estimate of $549 million. For fiscal 2019, revenues increased 29.7% year over year to $2,068.3 million on the back of solid execution across the company’s diversified business lines.
Quarterly Segmental Performance
Revenues from Satellite Services increased 31% year over year to $190 million on the back of higher ARPUs, up 15% year over year. The company continues to execute on its premium service strategy across its residential and enterprise markets. It witnessed higher customer satisfaction, lower churn rate and improved operating efficiencies, which contributed to adjusted EBITDA improvement. The segment’s operating profit was $0.7 million against loss of $21.1 million in the year-ago quarter. Adjusted EBITDA was $65.2 million, up 116.6% year over year, reflecting operating leverage inherit in Viasat’s fixed and mobile broadband service businesses.
Commercial Networks revenues were up 20.5% year over year to $91.8 million, as the company continued its in-flight connectivity (IFC) terminal delivery activities based on strong customer demand. The performance also reflected revenue growth across Viasat’s antenna systems infrastructure businesses and other satellite networking areas. The segment’s operating loss was $49.2 million compared with loss of $50.1 million in the year-ago quarter. Adjusted EBITDA was negative $34.3 million compared with negative $32.9 million a year ago. R&D expenses were down $7 million year over year, as Viasat progressed through final module test and validation for its first two ViaSat-3 class satellite payloads.
Revenues from Government Systems increased 25.9% year over year to $275.3 million, with most of this growth spread across the segment’s product lines. In services, strong gains were also witnessed as Viasat’s high capacity secure mobile broadband expanded operational capabilities across geographies and platforms. The segment’s operating profit was $60.2 million, up 48.3% year over year. Adjusted EBITDA was $77.3 million, up 32.4% year over year, reflecting the flow through top-line performance along with lower G&A and R&D as a percentage of revenues.
Cash Flow & Liquidity
During fiscal 2019, Viasat generated $327.6 million of cash from operations compared with $358.6 million in fiscal 2018.
As of Mar 31, 2019, the satellite and wireless networking technology provider had $261.7 million in cash and equivalents with $110 million of long-term debt compared with the respective tallies of $71.4 million and $287.5 million a year ago.
Zacks Rank & Other Stocks to Consider
Viasat currently sports a Zacks Rank #1 (Strong Buy). Other top-ranked stocks in the industry include Harris Corp. (NYSE:HRS) , Ubiquiti Networks, Inc. (NASDAQ:UBNT) and Juniper Networks, Inc. (NYSE:JNPR) , each carrying a Zacks Rank #2 (Buy). You can see the complete list of today’s Zacks #1 Rank stocks here.
Harris has long-term earnings growth expectation of 8%.
Ubiquiti has long-term earnings growth expectation of 19.8%.
Juniper has long-term earnings growth expectation of 6.2%.
Looking for Stocks with Skyrocketing Upside?
Zacks has just released a Special Report on the booming investment opportunities of legal marijuana.
Ignited by new referendums and legislation, this industry is expected to blast from an already robust $6.7 billion to $20.2 billion in 2021. Early investors stand to make a killing, but you have to be ready to act and know just where to look.
See the pot trades we're targeting>>
Juniper Networks, Inc. (JNPR): Free Stock Analysis Report
Ubiquiti Networks, Inc. (UBNT): Free Stock Analysis Report
Harris Corporation (HRS): Free Stock Analysis Report
Viasat Inc. (VSAT): Free Stock Analysis Report
Original post
Zacks Investment Research