A friend reached out to me the other day and asked me a simple question:
“If the average person gets a $3000 tax refund every year and then invests the refund into the S&P 500, what would their end result look like?”
No problem. All we need to do is make a few quick assumptions.
- Historically, going back to 1900, using Robert Shiller’s historical data, the market has averaged, more or less, 10% annually on a total return basis. Of that 10%, roughly 6% came from capital appreciation and 4% from dividends. (This is important and we will return to this later.)
- Given the lack of ability, and or desire, to save in younger years most people begin to get serious about saving money around 35 years of age on average.
- We will assume a retirement age of 65 which puts our saving and investing time frame at 30-years.
As I stated, this is a relatively easy calculation which you can find regularly espoused throughout the majority of the financial media, blogosphere, and Wall Street as the promise of “passive indexing” persists.
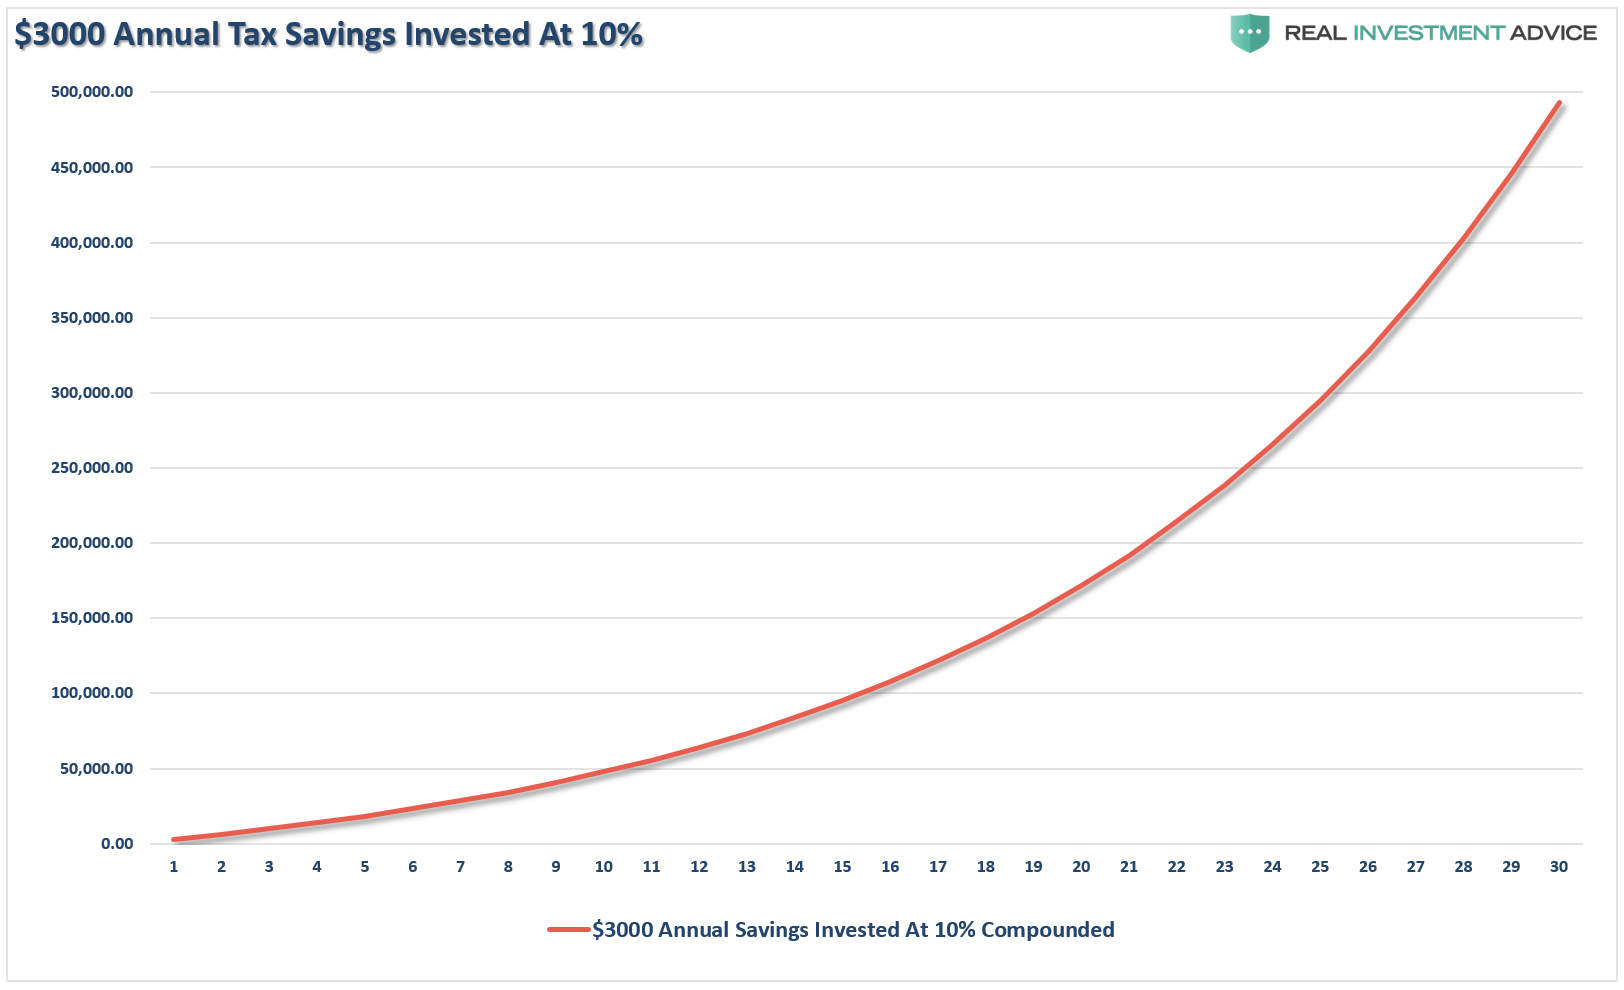
Not bad. The $3000 per year savings plan grows to a nice lump sum of $500,000.
This clearly supports the long-held belief that if you have 30-years to retirement, just dollar-cost average into some index funds and you will be fine.
You can stop reading now.
But What If The Entire Premise Is Flawed?
If, as a millennial investor, you really want to save and invest for retirement you need to understand how markets really work.
Markets are highly volatile over the long-term investment period. During any time horizon the biggest detractors from the achievement of financial goals come from five factors:
- Lack of capital to invest.
- Psychological and behavioral factors. (i.e. buy high/sell low)
- Variable rates of return.
- Time horizons, and;
- Beginning valuation levels
I have addressed the first two at length in Dalbar 2016, Why You Still Suck At Investing but the important points are these:
Despite your best intentions to “buy and hold” over the long-term, the reality is that you will unlikely achieve those promised returns.
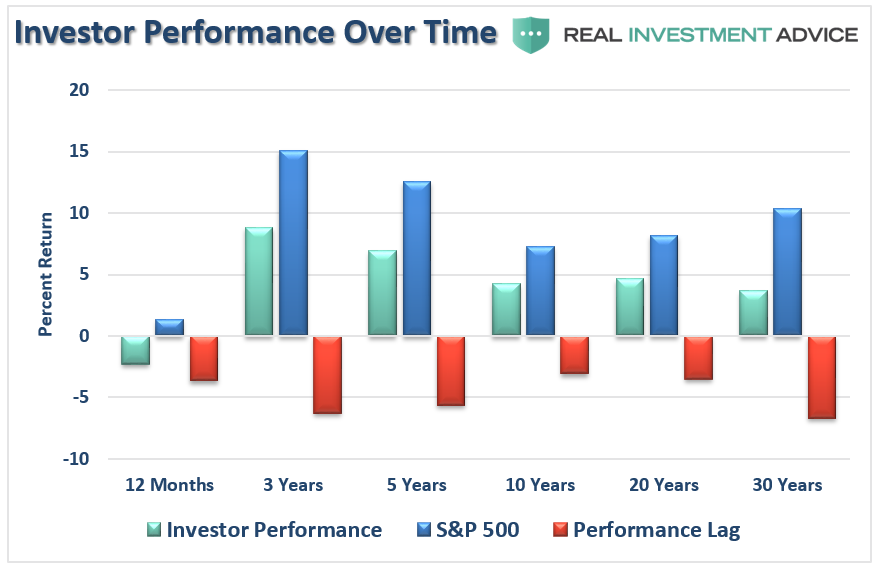
While the inability to participate in the financial markets is certainly a major issue, the biggest reason for underperformance by investors who do participate in the financial markets over time is psychology.
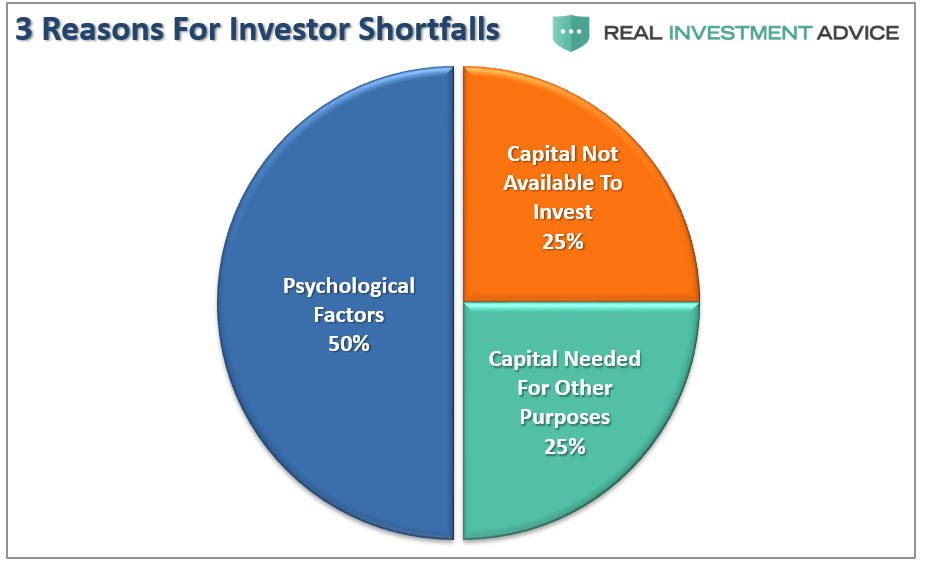
Behavioral biases that lead to poor investment decision-making is the single largest contributor to underperformance over time. Dalbar defined nine of the irrational investment behavior biases specifically:
- Loss Aversion – The fear of loss leads to a withdrawal of capital at the worst possible time. Also known as “panic selling.”
- Narrow Framing – Making decisions about on part of the portfolio without considering the effects on the total.
- Anchoring – The process of remaining focused on what happened previously and not adapting to a changing market.
- Mental Accounting – Separating performance of investments mentally to justify success and failure.
- Lack of Diversification – Believing a portfolio is diversified when in fact it is a highly correlated pool of assets.
- Herding– Following what everyone else is doing. Leads to “buy high/sell low.”
- Regret – Not performing a necessary action due to the regret of a previous failure.
- Media Response – The media has a bias to optimism to sell products from advertisers and attract view/readership.
- Optimism – Overly optimistic assumptions tend to lead to rather dramatic reversions when met with reality.
The biggest of these problems for individuals is the “herding effect” and “loss aversion.”
These two behaviors tend to function together compounding the issues of investor mistakes over time. As markets are rising, individuals are lead to believe that the current price trend will continue to last for an indefinite period. The longer the rising trend last, the more ingrained the belief becomes until the last of “holdouts” finally “buys in” as the financial markets evolve into a “euphoric state.”
As the markets decline, there is a slow realization that “this decline” is something more than a “buy the dip” opportunity. As losses mount, the anxiety of loss begins to mount until individuals seek to “avert further loss” by selling.
This is the basis of the “Buy High / Sell Low” syndrome that plagues investors over the long-term.
However, without understanding what drives market returns over the long term, you can’t understand the impact the market has on psychology and investor behavior.
Over any 30-year period the beginning valuation levels, the price your pay for your investments has a spectacular impact on future returns. I have highlighted return levels at 7-12x earnings and 18-22x earnings. We will use the average of 10x and 20x earnings for our savings analysis.
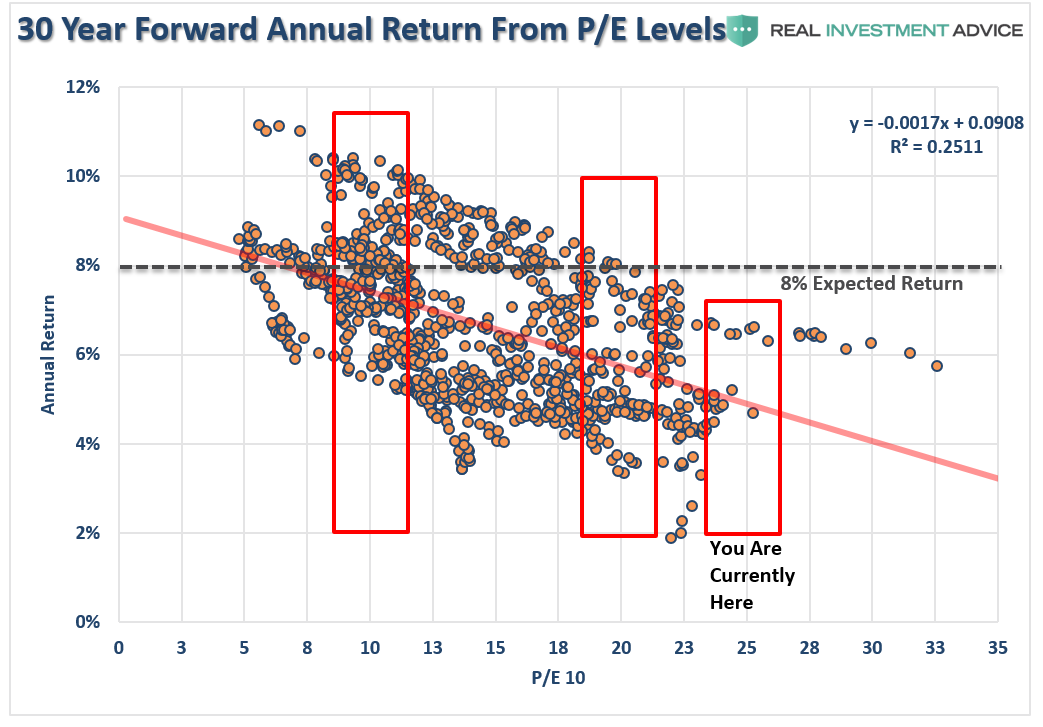
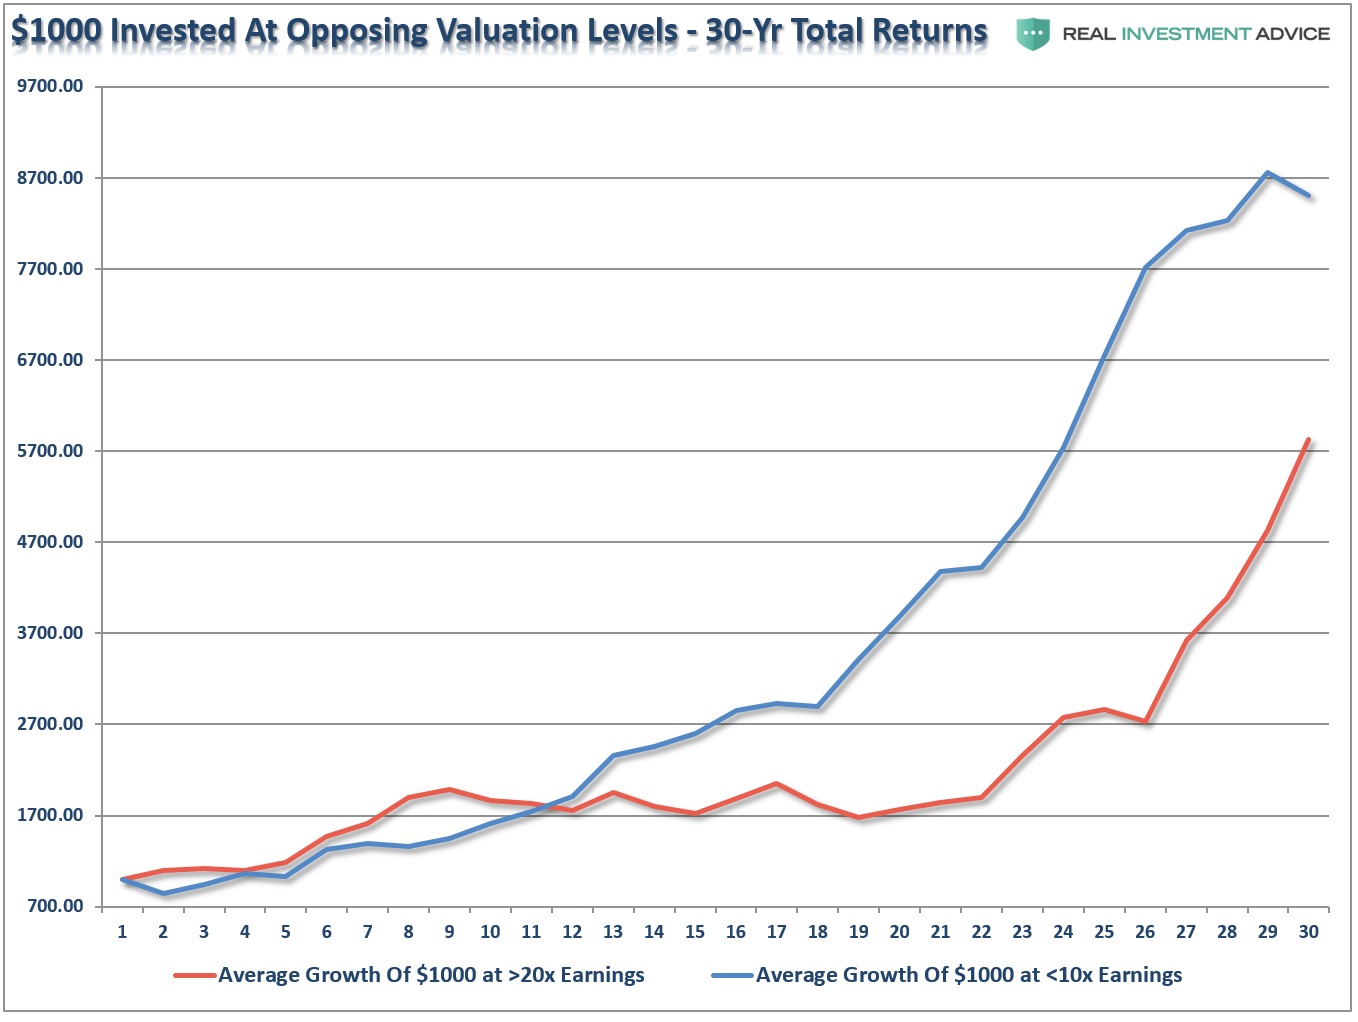
As you will notice, 30-year forward returns are significantly higher on average when investing at 10x earnings as opposed to 20x earnings or where we are currently near 25x.
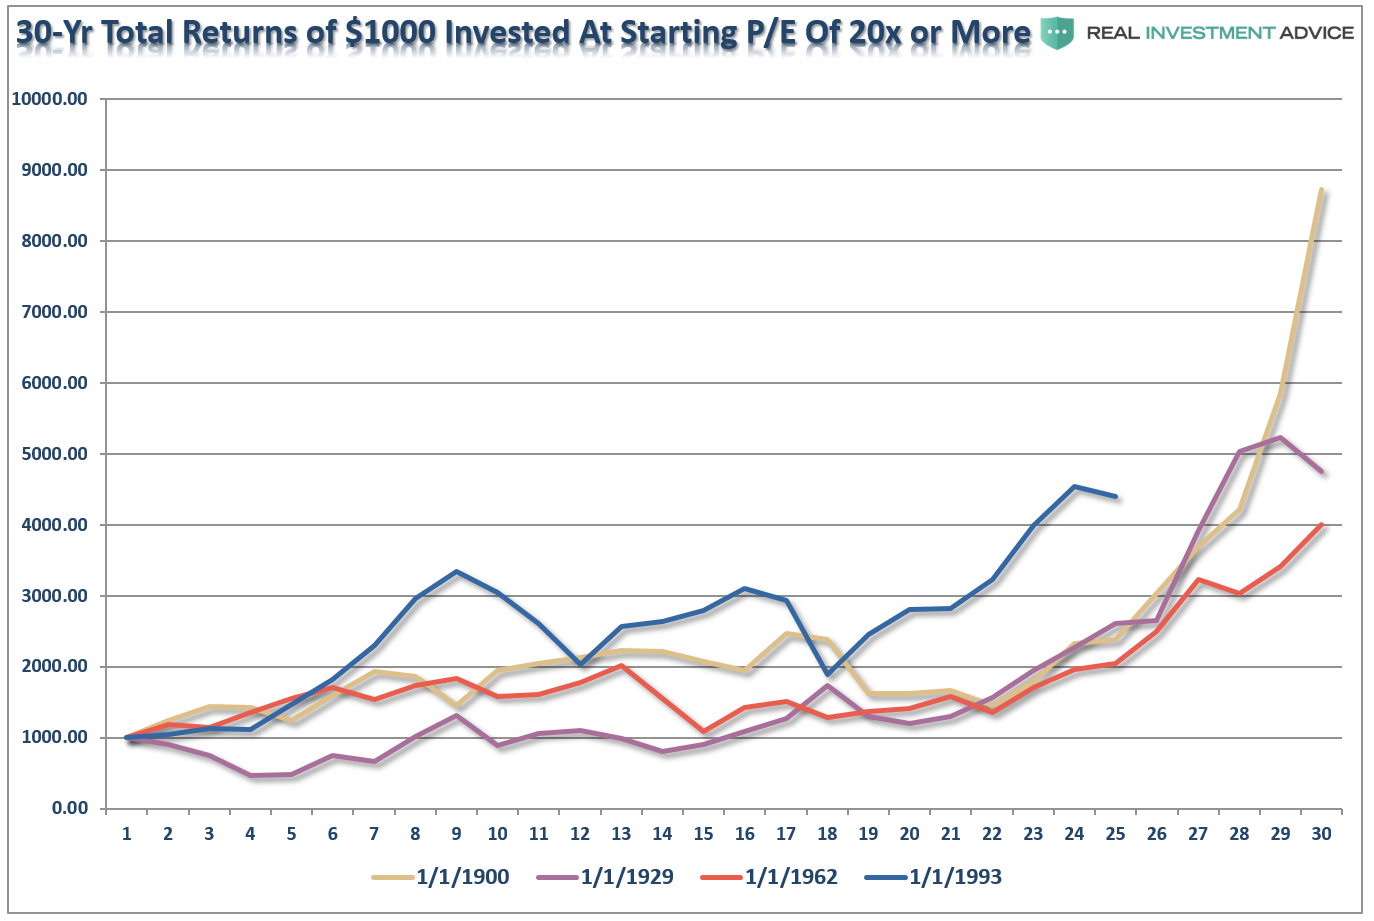
For the purpose of this exercise, I went back through history and pulled the 4-periods where valuations were either above 20x earnings or below 10x earnings. I then ran a $1000 investment going forward for 30-years on a total-return, inflation adjusted, basis.
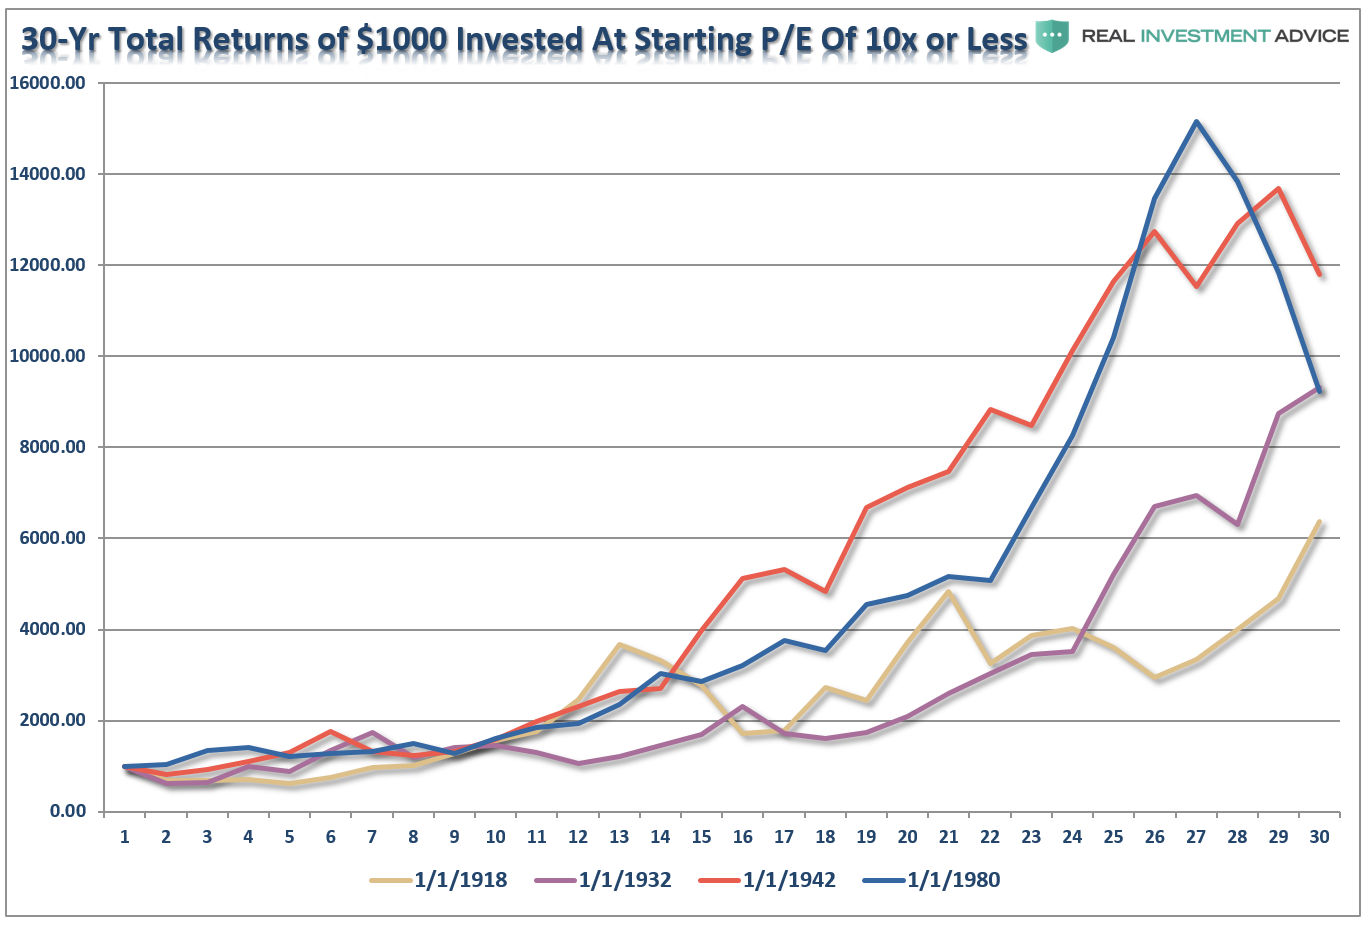
At 10x earnings, the worst performing period started in 1918 and only saw $1000 grow to a bit more than $6000. The best performing period was not the screaming bull market that started in 1980 because the last 10-years of that particular cycle caught the “dot.com” crash. It was the post-WWII bull market than ran from 1942 through 1972 that was the winner. Of course, the crash of 1974, just two years later, extracted a good bit of those returns.
Conversely, at 20x earnings, the best performing period started in 1900 which caught the rise of the market to its peak in 1929. Unfortunately, the next 4-years wiped out roughly 85% of those gains. However, outside of that one period, all of the other periods fared worse than investing at lower valuations. (Note: 1993 is still currently running as its 30-year period will end in 2023.)
The point to be made here is simple and was precisely summed up by Warren Buffett:
“Price is what you pay. Value is what you get.”
This is shown in the chart below. I have averaged each of the 4-periods above into a single total return, inflation adjusted, index, Clearly, investing at 10x earnings yields substantially better results.
So, with this understanding let me return once again to the young, Millennial saver, who is going to endeavor at saving their annual tax refund of $3000. The chart below shows $3000 invested annually into the S&P 500 inflation-adjusted, total return index at 10% compounded annually and both 10x and 20x valuation starting levels. I have also shown $3000 saved annually in a mattress.
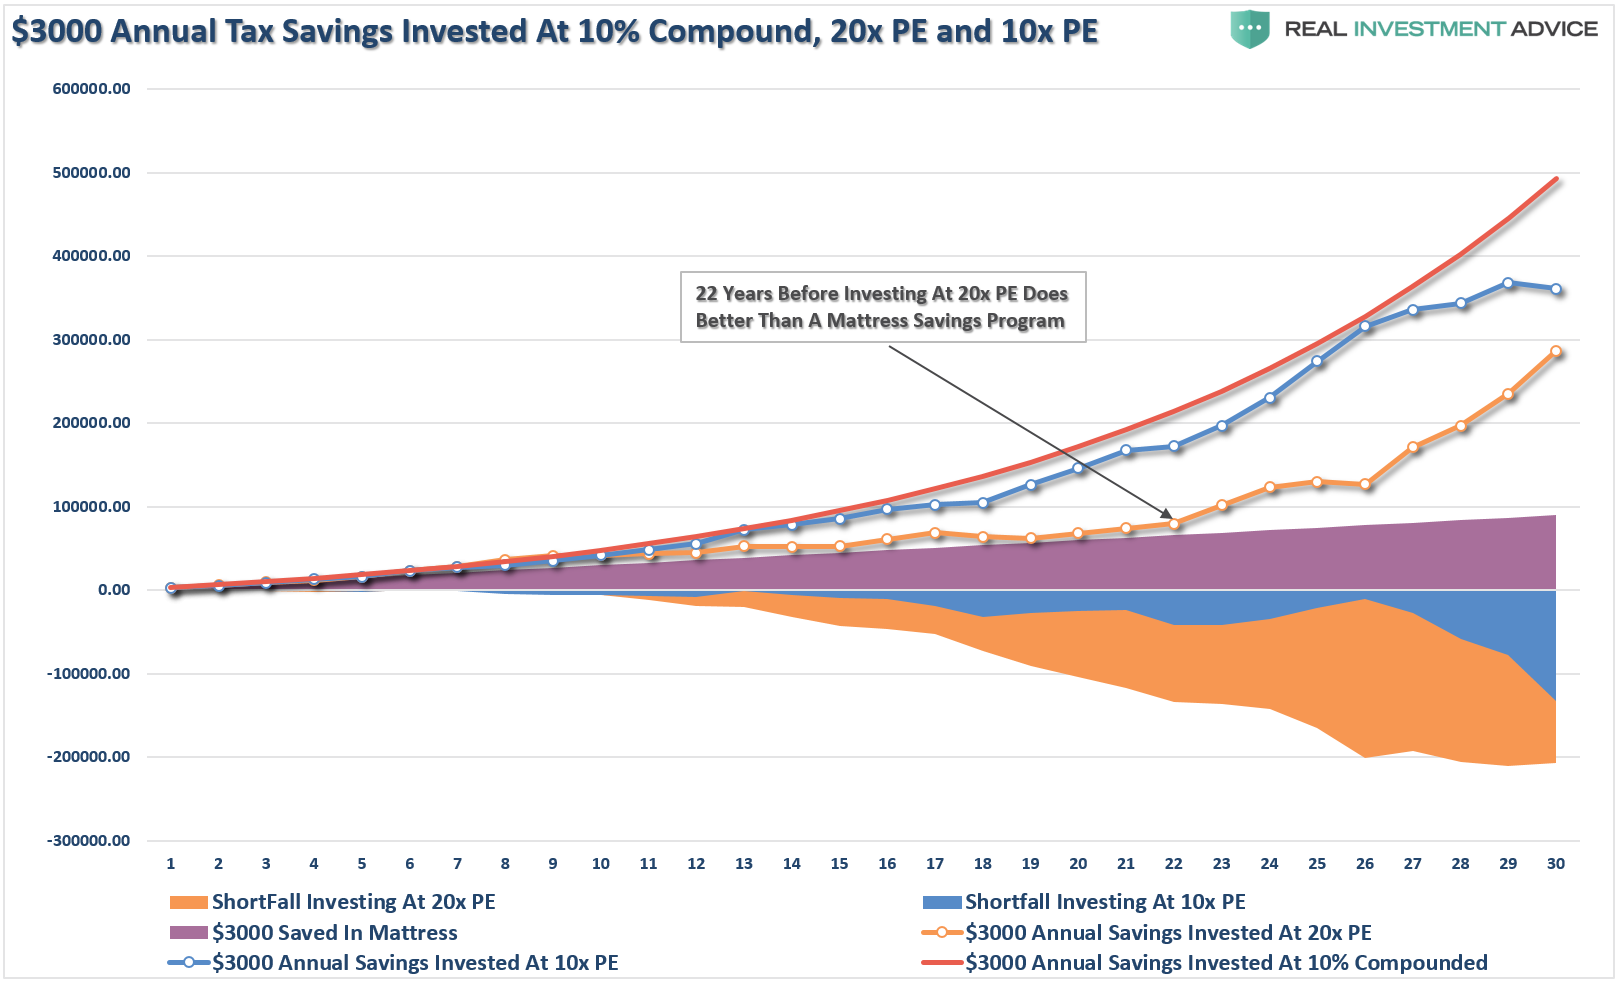
The red line is 10% compounded annually. You won’t get that but it is there so you can compare it to the real returns received over the 30-year investment horizon starting at 10x and 20x valuation levels. The short fall between the promised 10% annual rates of return and actual returns are shown by in two shaded areas. In other words, if our young saver was banking on some advisors promise of 10% annual returns for retirement, he isn’t going to make it.
I want you to take note of the point made that when investing your money when markets are above 20x earnings, it was 22-years before it grew more than money stuffed in a mattress. Why 22 years?
Take a look at the chart below.
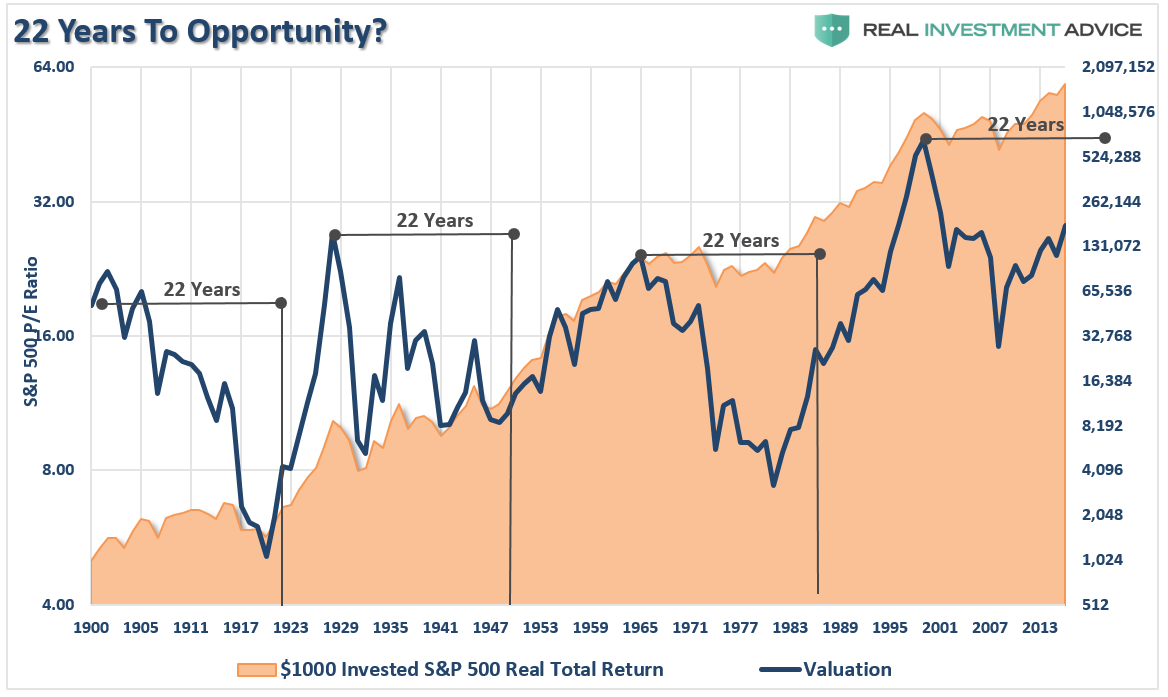
Historically, it has generally taken roughly 22-years to resolve a period of over-valuation. Given the last major over-valuation period started in 1999, history suggests another major market downturn will mean revert valuations by 2021.
The point here is obvious, but difficult to grasp from a mainstream media that is continually enticing young Millennial investors to mistakenly invest their savings into an overvalued market. Saving your money, and waiting for a valuation based opportunity to invest those savings in the market, is the best, safest way, to invest for your financial future.
Of course, Wall Street won’t like this much because they can’t charge you a fee if you are sitting on a mountain of cash awaiting the opportunity to “buy” their next misfortune.
But isn’t that what Baron Rothschild meant when quipped:
“The time to buy is when there’s blood in the streets.”
7-Steps To Long-Term Investment Success
With the market currently trading at the third-highest valuation level in history, only surpassed currently by the peaks in 1929 and 1999, you can only surmise what the outcome for our young saver will likely be.
The analysis reveals the important points individuals should consider given current valuation levels and the reality of investing over the long-term:
- Expectations for future returns should be downwardly adjusted.
- The potential for front-loaded returns going forward is unlikely.
- Control investment behaviors and emotions that detract from portfolio returns is critical.
- Future inflation expectations must be carefully considered.
- Understand risk and control drawdowns in portfolios during market declines.
- Save money regularly, invest when reward outweighs the risk.
- Expectations for compounded annual rates of returns should be dismissed
Investing is not a competition. There are no awards for beating the market, but there are severe and lasting consequences for chasing markets where others fear to tread.
You are fine as long as there is a “greater fool” to eventually sell to. Just make sure that “fool” is not you.
