
INTRADAY CHART
 USD/JPY: 60 Minute" title="FXS1" width="601" height="348">
June 4
USD/JPY: 60 Minute" title="FXS1" width="601" height="348">June 4
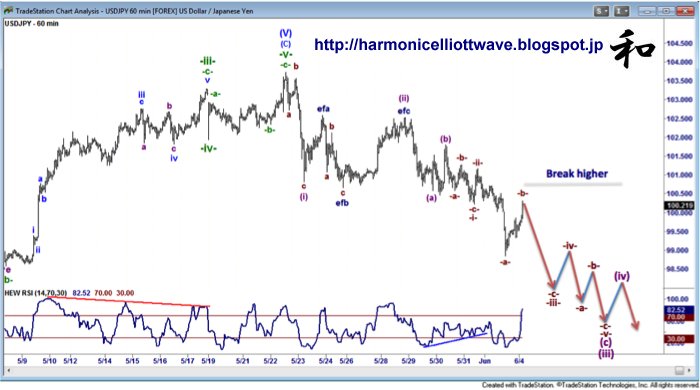
I have to say this is mighty complicated but attempting to judge the final stalling point above the Wave (B) of (V) we should see Wave -iii- stall in the 198.4%-238.2% % projection at 97.40 - 98.03 (I prefer the higher) and the Wave (iii) between the 198.4% - 238.2% at 95.59 - 96.75 (again I prefer the higher).
Overall these projections lower would take the Wave (v) into the broad 93 - 94 area.
Any earlier break above the 100.50-70 pivot area would risk gains back to the 103.73 high and then maybe it will go to 105.28... I do find that hard seeing how far we have dropped though...