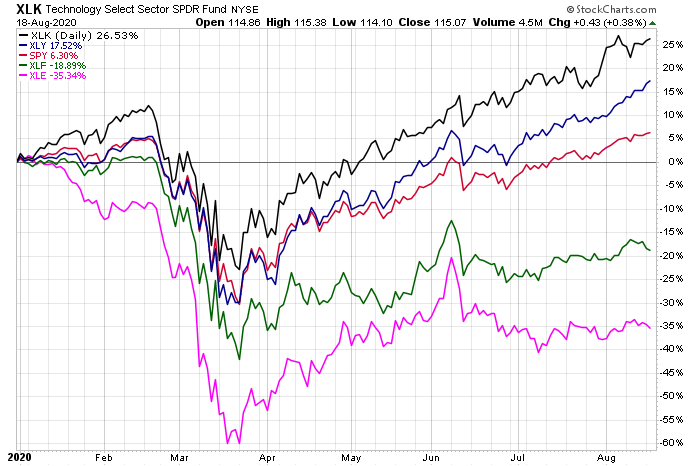
The U.S. stock market wiped out the last of its coronavirus losses on Tuesday (Aug. 18), delivering a rapid rebound from a devastating drawdown. As Reuters notes, this year’s slide is the shortest bear market on record. But from the perspective of the market’s sectors, there’s a wide array of pain and gain to consider.
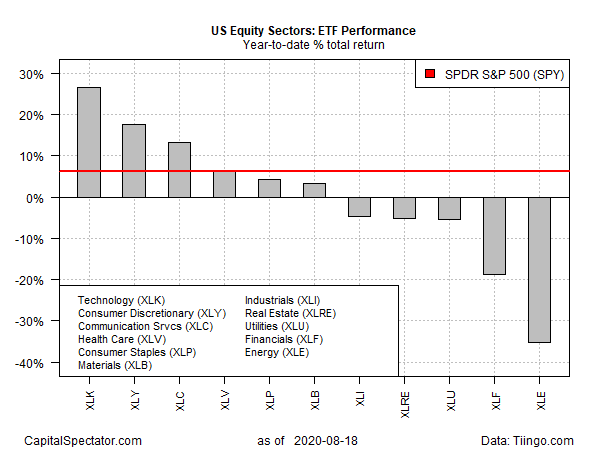
Let’s start with the current year-to-date results, based on a set of exchange traded funds. The broad market’s up 6.3% in 2020 through yesterday’s close, based on SPDR S&P 500 (NYSE:SPY), but that solid gain masks a wide range of sector performances.

Indeed, the leading sector drivers for the S&P’s rise this year are tech (NYSE:XLK) and consumer discretionary (NYSE:XLY), which are up 26.5% and 17.5%, respectively. By contrast, financials (NYSE:XLF) and energy (NYSE:XLE) are deep in the hole on year-to-date basis, nursing losses of 18.9% and 35.3%, respectively.

The energy sector’s woes are well known, including faltering demand, oversupply and growing opposition to fossil fuels as the threat of climate change rises.
The troubles for financials – banks in particular – may not resonate as deeply to the wider world, but the challenges are significant. In a world of ultra-low interest rates and flat yield curves, to name just two issues, the traditional bank-lending model is under extreme pressure.
In a symbolic blow to the banking industry, uber-investor Warren Buffett recently reduced holdings in shares of several big banks and bought stock in Barrick Gold (NYSE:GOLD), a mining company focused on the precious metal. Gold, of course, is the traditional alternative asset to the financial system and fiat currencies and so by some accounts Buffett’s Barrick purchase speaks volumes about the risk for banks.
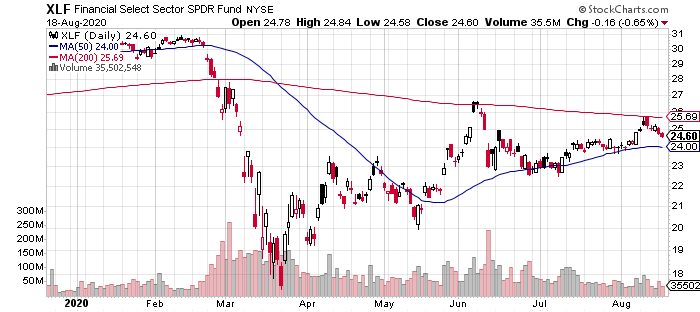
Whatever the future holds for the financial sector, stocks in this corner certainly aren’t participating in the S&P’s relief rally. After bouncing from the worst of the March selloff, XLF has been treading water since June at prices well below its pre-coronavirus trading range.

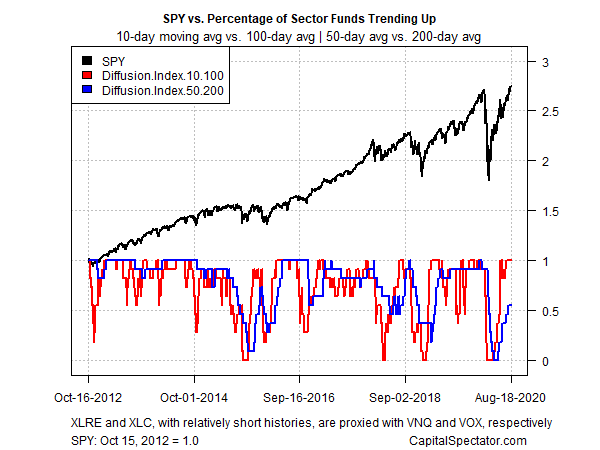
Although financials and energy are part of the market’s rally of late, XLF and XLE have managed, just barely, to tick higher relative to price levels in the last several weeks. As a result, a momentum profile of the sector funds listed above shows that all corners are enjoying an upside bias on a short-term basis. Long-term momentum, by contrast, is a mixed bag.
The profile in the chart below is based on two sets of moving averages. The first measure compares the 10-day average with its 100-day counterpart — a proxy for short-term trending behavior (red line in chart below). A second set of moving averages (50 and 200 days) represent an intermediate measure of the trend (blue line). Data through yesterday’s close shows that all the equity sectors are posting bullish short-term momentum as longer-term momentum (blue line) struggles to play catch-up.

