
With less than a month before the US elections, market participants have started paying more attention to polls, debates and headlines surrounding the event. They are trying to figure out what implications will the outcome have for the global financial markets.
In this report, we present our own humble view on how the markets may respond to the election result, though that’s not an easy task to do. Remember that ahead of the 2016 election, the financial community was nearly certain that Trump would prove negative for equities, but in fact, after the result was sealed, the stock market skyrocketed.
US Citizens Decide On The Next US President
On Nov. 3, US citizens head to the ballots for the 59th presidential election. Although they will choose for their candidate of preference, they are actually voting for electors, who, in their turn, will vote on Dec.14 for the next president and vice president.
Incumbents Donald Trump and Mike Pence secured the Republican nominations without any serious opposition, while former vice president Joe Biden secured the Democratic nomination over his closest rival, Bernie Sanders.
On Aug. 11, Biden officially announced that his mate for vice president would be Senator Kamala Harris, which makes her the first African-American, the first Indian-American, the first Asian-American, and the third female vice-presidential nominee on a major party ticket. With regards to other parties, the nominees for Liberals are Jo Jorgensen and Spike Cohen, while for the Greens, nominees are Howie Hawkins and Angela Nicole Walker.
Biden Leads The Polls
According to national polls, the two frontrunners are, by far, Donald Trump and Joe Biden, with the latter leading by 51% to 42%. Polls are a good guide in revealing the popularity of a candidate, but they are not necessarily accurate in predicting the election result.
Just take the 2016 elections. Hillary Clinton led the polls and even gained around three million votes more than Trump did, but still, she lost. In the US, winning the most votes does not necessarily guaranties a victory as the nation uses an electoral college system.
Electoral College System
The electoral college is the group of electors we already mentioned. The number of electors from each state is nearly proportional to the size of its population. There are 538 electors in total, and thus, for a candidate to lock the position in the Oval Office, it must gather a total of 270, or more, votes.
Generally, states give their electoral votes to whoever wins the ordinary voters. For example, if Biden wins 55% of the votes in California, he will be awarded all the state’s electoral votes.
There are only two states, Maine and Nebraska, which divide their electors according to the votes each candidate receives. In some states, electors could vote for any candidate they choose, even if citizens voted for another candidate. Nevertheless, almost always, electors select for the candidate who receives the most votes in their state.
What Affected Trump's Popularity?
At the moment, polls in the battleground states favor Joe Biden. So, which were the events that affected Trump’s popularity the most? First and foremost, we have the coronavirus pandemic.
Support for the way he dealt with the crisis peaked in March when he declared a national emergency and offered USD 50bn in aid for stopping the spread of the virus. However, the support to his response has since declined, with even his own supporters questioning his approach, as the virus kept spreading in the US at an extremely fast pace.
The US-China trade sequel has also dominated headlines during Donald Trump’s term, with the US President imposing tariffs on imports from China, and China retaliating in a similar fashion. All this has become a burden to exporters who may eventually decide to vote for another president. Last but not least, we have the way President Trump responded to the widespread protests over racial injustice.
Market Implications
So, what are market participants looking in each candidate and what impact the election result could have in the financial world? Incumbent President Donald Trump has pledged to keep the 2017 corporate tax cuts in place, which could prove positive for US equities.
The opposite may be true if Biden wins, as the Democratic candidate has called for an increase in taxes on corporations and high-income individuals. However, Biden’s spending plans are unlikely to allow a major trend reversal.
Perhaps we’ll get a decent correction before the prevailing uptrend’s revival. Stocks in the rest of the world may not react in a similar fashion as the US ones. A Trump reelection may result in more trade frictions between the US and other nations, especially China, and thus, equities outside the US may retreat in case Trump keeps his throne.
Biden is expected to adopt a softer stance on trade, which means that global equities may rebound if he is victorious, even if US indices retreat. In the graph below, we can clearly see that US stocks performed much better than their European and Asian counterparts during Trump’s term.
In the FX world, a Biden victory may result in a slide in the US dollar. Both candidates are expected to push for more infrastructure spending, but Biden’s agenda is looser, which combined with an extra-accommodative Fed may result in some dollar selling.
The yen and other safe havens could also slide on expectations of a better handling of international trade relations, while the commodity-linked Aussie and Kiwi could strengthen.
The opposite may be true if Trump gets reelected. Now in case we get an extended period of uncertainty, due to either delays in announcing a winner, or even a contested election (Trump said that he may not accept a defeat as mail-in balloting could lead to voter fraud), risk assets around the globe may suffer as investors seek shelter in safe havens until we have a clear outcome.
Congress Composition Could Also Play. A Role
Having said all that, the market reaction may also depend on which party will gain majority in US Congress. The Congress consists of two chambers: The House of Representatives and the Senate. Currently, Democrats hold the majority in the House, while the Senate is controlled by the Republicans. Whoever gets elected, a failure of his party to take full control of the Congress may result in a more modest market reaction, as he may not be able to push through with his agenda. For example, if Biden is elected, but fails to flip the Senate, stock markets may not slide that much, on expectations that Republicans may veto his decision of increasing corporate taxes. Republicans may also oppose his spending agenda, which means a softer slide in the dollar than otherwise.
Technical Outlook S&P 500
The S&P 500 is currently trading near its all-time high, at around 3588 level, which was reached in the beginning of September. Although the price is very close to that level, investors might stand pat until the results of the US Presidential elections are clear. As we already know, the Trump victory is seen as a more favourable for the stock market, due to his US business-friendly policies.
However, the Biden victory could initially be taken as a negative, but we doubt that it could result in the beginning of a bear market. We would need to see a sharp slide below some of our key support levels, such as 3209, or the psychological 3000 territory, before we could start examining lower areas, at least in the medium term.
During the days before the announcement of the election results, the S&P 500 might remain slightly below the all-time figure, at 3588. In case Biden is victorious, market participants may initially take it as a negative, causing the US index to slide, possibly even all the way to somewhere near the 3300 zone. That zone acted as a good support area between mid-August and the end of September, not allowing any of our weekly candles to close below it. If that area does the same trick again and holds the price from falling, the buyers may get back into the game again and push the S&P 500 north, potentially targeting the 3588 level, or higher.
For now, Trumps victory is seen as a positive for the stocks, so if he wins, the index might overcome the current all-time high, at 3588, which may open the door towards higher levels, as such a move would confirm a forthcoming higher high. But because this would place the S&P 500 into uncharted territory, we could only assume that the price might rise then to such levels like 3700, or even to the psychological 4000 mark.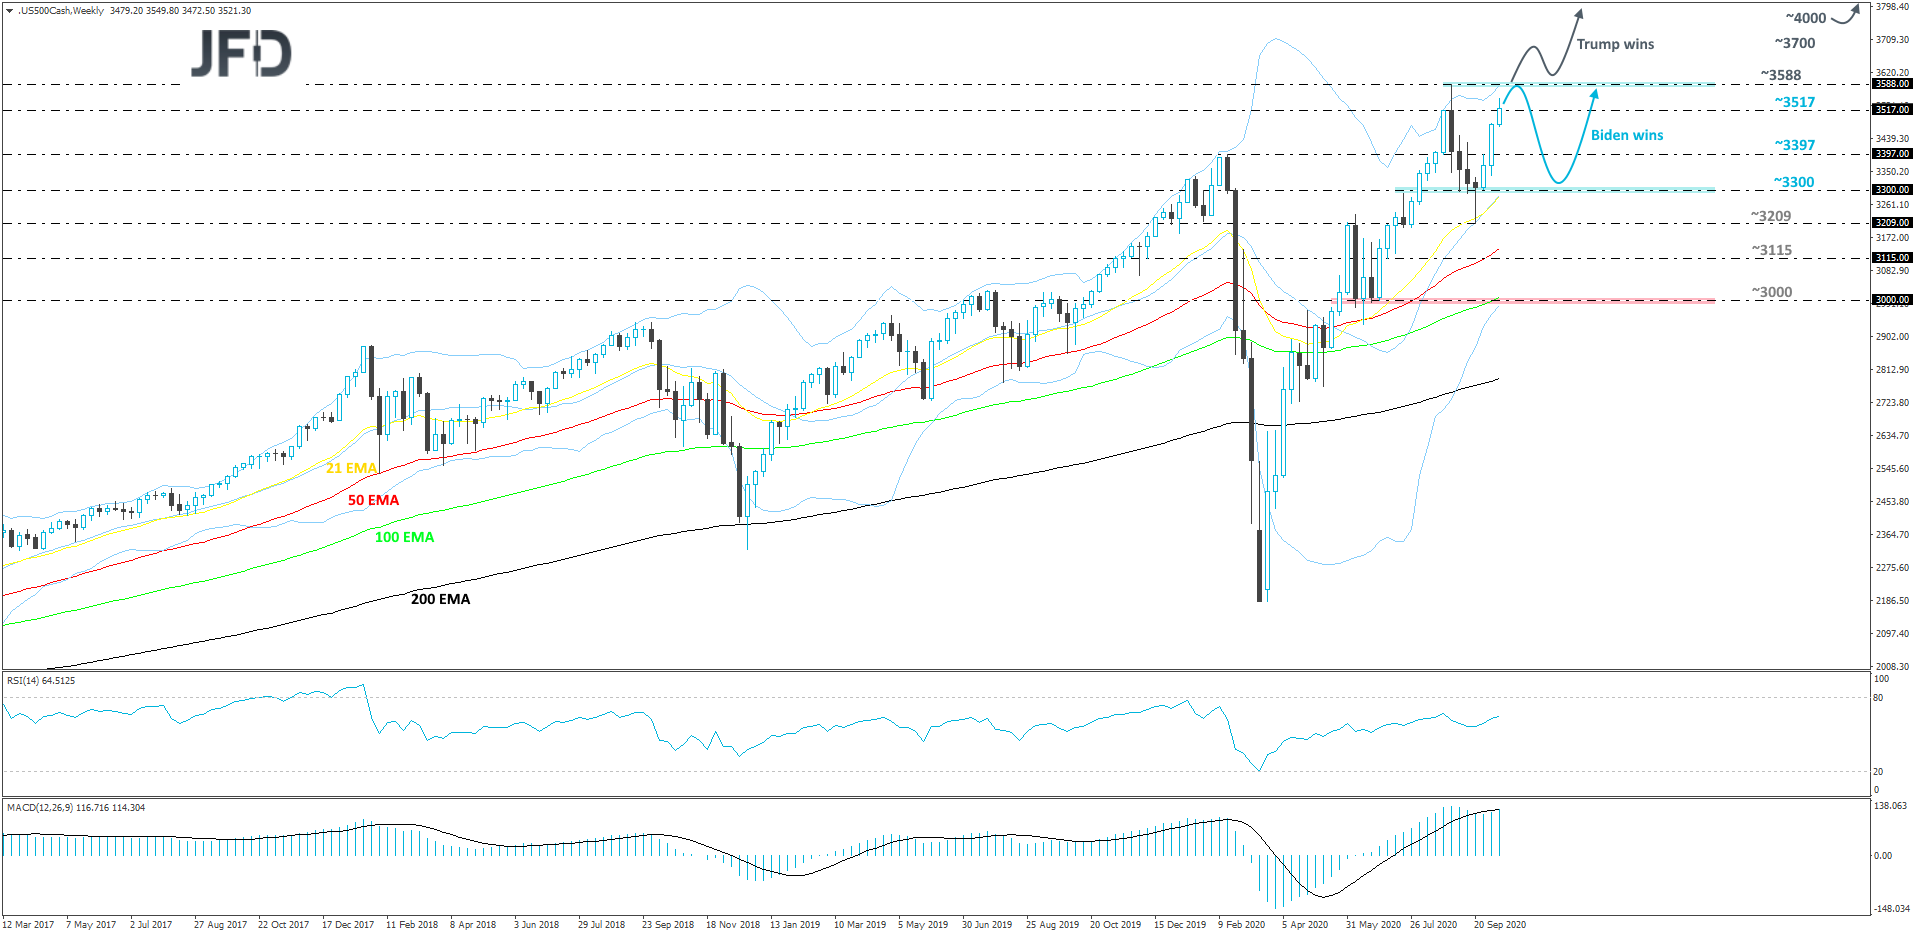
DAX
From around the beginning of June, the German DAX continues to grind higher, but in an organised fashion, within a rising channel pattern. Comparing to the upmove, which we saw from the end of March till the end of May, the index had slowed down a bit, but still remains attractive for the buyers. DAX traders and investors are also waiting for the results of the US Presidential election, which might work out either way for DAX, depending on who takes the White House office.
In the scenario of Biden’s win, the German index may pop higher, as he is seen as a more lenient candidate, who might not be as tough on Europe, and in particular to Germany-US trade. DAX might push above the highest point of September, at 13461, which could clear the path towards the all-time high, at around 13828, or to the upper bound of the aforementioned channel. That area could provide initial resistance, possibly causing a small correction back down. However, if the price continues to balance above the 13461 zone, another potential uprise could be possible. If this time the buyers are able to lift the index above that 13828 hurdle, this would put DAX into the uncharted territory, where we may aim for levels like 14000, or higher.
On the other hand, a Trump win might put a bit of pressure on the German index initially, causing it to slide and potentially test the lower side of the previously mentioned rising channel. If that bound is able to withstand the sellers, the buyers might jump in and drive DAX up again. If so, the price may get back to the area between the 13340 and 13461 levels, marked by the highs of September 14th and 3rd respectively. If the buying doesn’t stop there, a further push north might bring DAX closer to the current all-time high level, at 13828, for a quick test.
EUR/USD
It seems that EUR/USD traders have taken somewhat of a pause, after the pair’s summer rally. The rate found resistance just slightly above the psychological 1.2000 zone, at 1.2010. From there the pair corrected back down, but found some support near the 1.1610 hurdle and then moved up again. EUR/USD is currently trading between those two levels, probably in anticipation of the outcome from the US Presidential elections.
If Biden takes the office, that could be a positive for EUR/USD, as the Democrats are willing to go for bigger spending, which may push the greenback slightly lower. More buying interest might come in if the pair pushes above the psychological 1.2000 zone, or the aforementioned 1.2010 barrier. Such a move would confirm a forthcoming higher high, potentially opening the door for a move to the 1.2155 hurdle, marked by the lowest point of March 2018, or to the 1.2260 area, which acted as a good support between mid-March and mid-April of the same year. The uprise could get halted there for a while, however if the bulls are still in charge, a further push higher may set the stage for a move to the 1.2414 level. That level marks the highest point of April 2018.
In case of Trump winning the election, the US dollar might take a stronger stance against its major counterparts, including the euro, causing EUR/USD to slide. The sellers could keep their eyes locked on the lowest point of September, which is near the 1.1610 area, a break of which might open the door to some lower levels, as a forthcoming lower low would be confirmed. That’s when the pair may slide to the 1.1495 obstacle, or to the 1.1422 hurdle, marked by the highs of March and June respectively. The slide might get stopped near the latter level, as around there the rate could be supported by the 200 EMA. That said, if the bears regroup and eventually overcome that 200 EMA, together with the 1.1422 hurdle, this might result in a drop to the 1.1168 zone, marked by the lowest point of June 2020.
AUD/JPY
Looking at the technical picture of AUD/JPY on the weekly chart, we can see that the rate tested the 200 EMA in August and then corrected back down. Then the pair found good support near the 50 EMA, around the 74.00 hurdle, from where it rebounded and made its way higher again. The rate is now stuck between the 74.00 and 78.46 levels, in a way showing that it is waiting for a trigger that could take it outside of those boundaries. One of those triggers might be the outcome of the US Presidential elections. If Biden wins, there might be a light in the end of the tunnel for AUD, as it is seen as commodity linked currency. It tends to suffer, when US and China are having trade disputes, however, with Biden in office, those tensions could be resolved quicker. That might be favourable for the Australian dollar.
If Biden wins, AUD/JPY might travel above the previously-discussed resistance area, at 78.46, marked by the highest point of August. At the same time, the rate would be placed above the 200 EMA, what some buyers could see as a positive. The pair may then travel to the 80.72 obstacle, or even the 83.90 level, which marks the highest point of December 2018.
The opposite might happen, if Trump wins, as AUD/JPY may slide below the lowest point of September, at 74.00, this way confirming a forthcoming lower low and opening the way towards further declines. The pair could then drift to the 72.52 hurdle, a break of which might set the stage for a slide to the 70.16 and 69.95 levels. Those levels mark the highest point of April 2020 and the lowest point of 2019 respectively.