I have been closely monitoring the charts listed in the title. Here is an update of my chart observations.
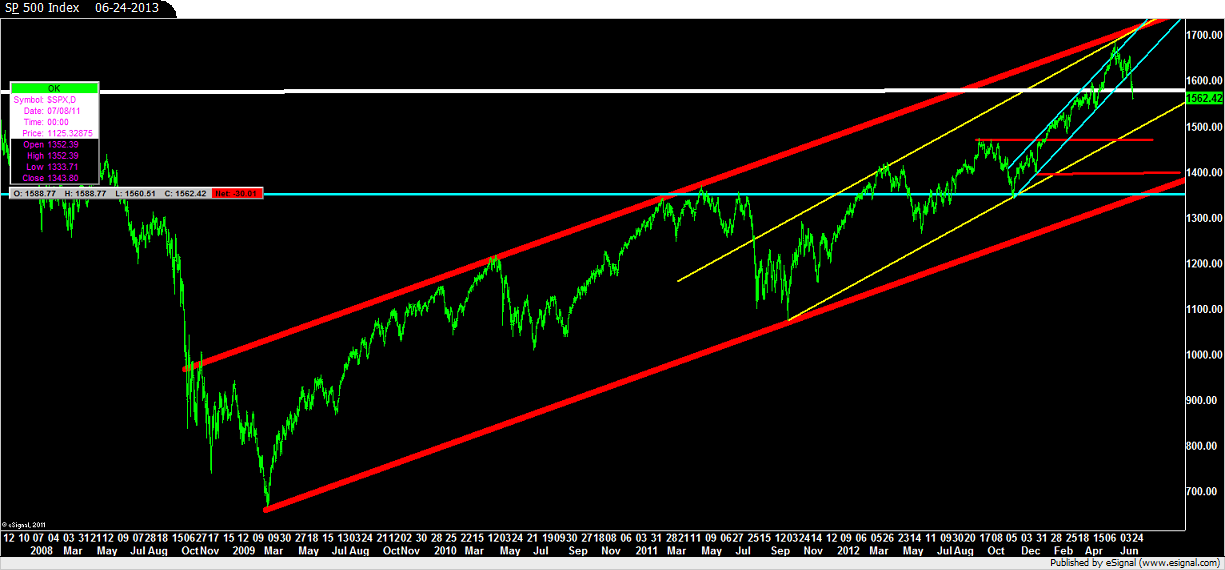
The S&P 500 Index is in the midst of a correction. The minor-minor trend channel (e.g. in blue) has had its support line breached with momentum. The previous all-time high (e.g. horizontal white line at the 1575.00 area) has been retested today. It will remain to be seen if this area holds. A move beneath 1540 will confirm for me that support rendered from the previous all-time high has failed.
Stronger S&P 500 support lies under the market at the minor trend channel support line. The minor bullish trend channel is shown as the parallel yellow rising lines. Minor trend channel support comes in at the 1500 level given the market’s current downward trajectory.
Major support appears 10% below current levels at the major trend channel support line, which is the bold red rising support trend line. At the current trajectory, that level seems to be in the 1400.00 area for the S&P; but the actual level will depend upon the future market trajectory. The major bullish trend channel dates back to March of 2009, when the cyclical market low of 666.00 was placed.
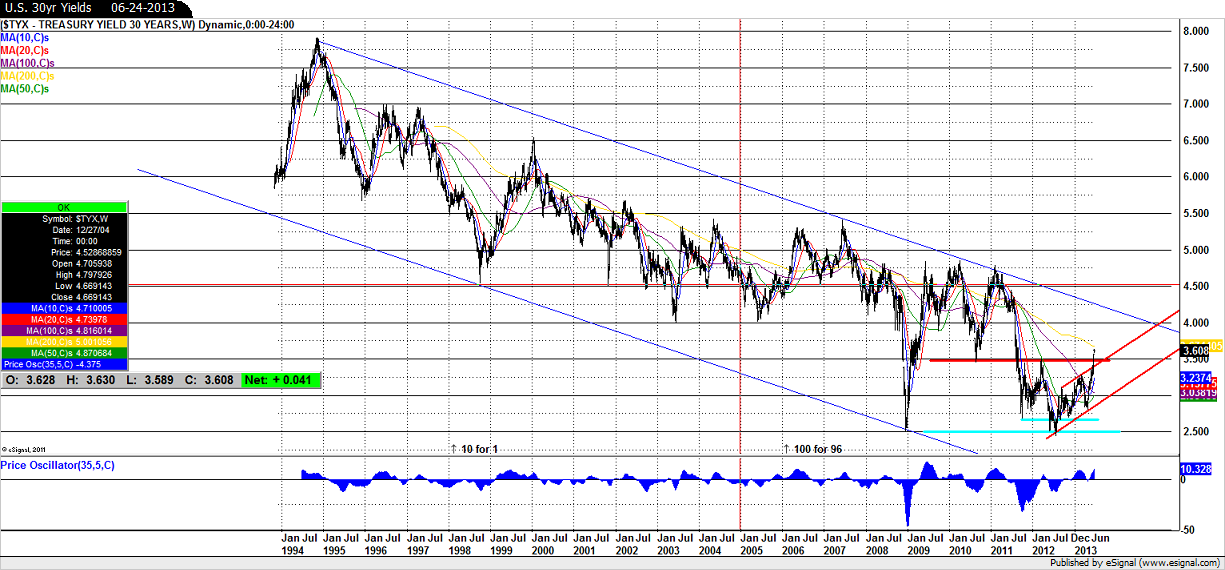
This next chart is the weekly bar representing yields for the 30yr U.S. Treasury Bond. The 3.5% resistance area of concern (e.g. horizontal red line) has been violated, but only a move above the 200 week moving average (e.g. yellow moving average at the 3.67% area) will confirm a breaching with momentum of the 3.5% area.
Major resistance for 30yr yields is offered by the descending major bearish trend channel that dates back even further than 1994, and which is shown on this chart as the falling parallel blue lines. Resistance rendered from this extremely lengthy pattern stands ready at the 4.25% level, given the market’s current trajectory.
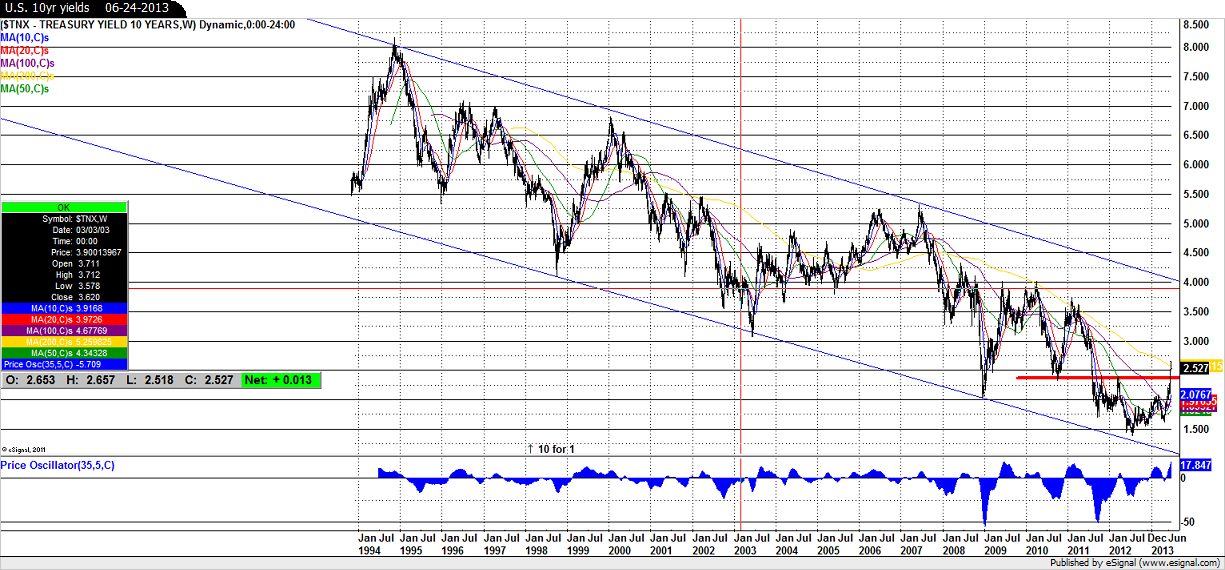
The final chart is a weekly bar of U.S. 10yr Treasury Note yields. A similar major bearish trend channel is in place for 10yr yields. Initial resistance at 2.4% (e.g. horizontal red line) has been breached with momentum as yields have gapped above the 200 week moving average at 2.57% (e.g. the yellow moving average). Final resistance is offered somewhere shy of 4% given the market’s current trajectory.
In conclusion, although significant long term support remains beneath present S&P 500 levels, the S&P’s strength is finally being tested. The market has previously been on a seemingly perpetual joy ride. We shall see if this is merely a small correction, or the start of something larger. The good news is that chart support levels are very well defined, and should offer assistance for these considerations.
In addition, U.S. yields continue to spike upward, and a rising yield environment will probably be bad for stocks as well as bonds. Is the dreaded simultaneous sell-off of both stocks and bonds upon us? Only time will tell. 
Even though initial resistance areas for yields appear to have been breached, long term major resistance remains in place. However, as U.S. debt has increased over time, it’s quite possible that the major resistance levels represented on charts are problematic for Treasuries yields, even though the levels are within long term trend parameters. For instance, if 10yr yields were to approach the 4% major resistance area, the debt grows even larger; and many argue we are getting close to the endpoint of debt repayment sustainability.
The QE actions of the Fed have undoubtedly bought time and provided for a smooth last three years. Yields remain in a long term downtrend and are not yet problematic. But has the Fed backed us into a corner? It seems the Fed has not only artificially lowered Treasury yields, but may also have inadvertently artificially lowered chart resistance levels as well. For instance, if bond markets are destabilized prior to yields reaching the upper extremities of resistance levels, yields may very well blow through the major resistance with ease.
Finally, I suggest you seek advice about the potential effects of a rising Treasury yield environment and at least prepare yourself. I further suggest you become more concerned about those potential effects if and when the bearish major trend channel patterns for yields become invalidated.
Important Disclosures
Please be aware that this is not a recommendation to purchase or sell any security. This is not a recommendation for any individual or institution to alter their portfolio holdings. Every individual or institution has its own risk tolerance and investment objectives and perspectives.
Any above opinions of the author should be viewed as such. These opinions in no way represent any type of guarantee. The above opinions are meant to stimulate thought and should be viewed as such. You are encouraged to discuss these views with your representatives if you have any questions or concerns.
Realize that if you choose to invest in securities, investing in securities carries with it uncertainty and the risk of loss of principal. Lost investment opportunity is also a possibility. Investing in securities carries no guarantees, and past performance is no guarantee of future results. The price movements within capital markets cannot be guaranteed and always remain uncertain.
Any indices mentioned are unmanaged and cannot be invested in directly.
It must here be mentioned that technical analysis offers no guarantees of future price movements. Technical analysis represents an observation of past performance and trend, and past performance and trend are no guarantee of future performance, price or trend. The price movements within capital markets cannot be guaranteed and always remain uncertain.
Neither Cambridge Investment Research nor Preferred Planning Concepts is responsible for the accuracy of content provided by third parties. All material presented herein is believed to be reliable but we cannot attest its accuracy.
Any charts presented were made available by eSignal, a charting service available to individuals or professionals. Anyone interested in exploring the potentials of eSignal should give them a call.
- English (UK)
- English (India)
- English (Canada)
- English (Australia)
- English (South Africa)
- English (Philippines)
- English (Nigeria)
- Deutsch
- Español (España)
- Español (México)
- Français
- Italiano
- Nederlands
- Português (Portugal)
- Polski
- Português (Brasil)
- Русский
- Türkçe
- العربية
- Ελληνικά
- Svenska
- Suomi
- עברית
- 日本語
- 한국어
- 简体中文
- 繁體中文
- Bahasa Indonesia
- Bahasa Melayu
- ไทย
- Tiếng Việt
- हिंदी
Updated Charts: S&P 500 In Midst Of A Correction
Published 06/25/2013, 03:49 AM
Updated 07/09/2023, 06:31 AM
Updated Charts: S&P 500 In Midst Of A Correction
Latest comments
Loading next article…
Install Our App
Risk Disclosure: Trading in financial instruments and/or cryptocurrencies involves high risks including the risk of losing some, or all, of your investment amount, and may not be suitable for all investors. Prices of cryptocurrencies are extremely volatile and may be affected by external factors such as financial, regulatory or political events. Trading on margin increases the financial risks.
Before deciding to trade in financial instrument or cryptocurrencies you should be fully informed of the risks and costs associated with trading the financial markets, carefully consider your investment objectives, level of experience, and risk appetite, and seek professional advice where needed.
Fusion Media would like to remind you that the data contained in this website is not necessarily real-time nor accurate. The data and prices on the website are not necessarily provided by any market or exchange, but may be provided by market makers, and so prices may not be accurate and may differ from the actual price at any given market, meaning prices are indicative and not appropriate for trading purposes. Fusion Media and any provider of the data contained in this website will not accept liability for any loss or damage as a result of your trading, or your reliance on the information contained within this website.
It is prohibited to use, store, reproduce, display, modify, transmit or distribute the data contained in this website without the explicit prior written permission of Fusion Media and/or the data provider. All intellectual property rights are reserved by the providers and/or the exchange providing the data contained in this website.
Fusion Media may be compensated by the advertisers that appear on the website, based on your interaction with the advertisements or advertisers.
© 2007-2024 - Fusion Media Limited. All Rights Reserved.