
Unum Group’s (NYSE:UNM) third-quarter 2019 operating net income of $1.36 per share missed the Zacks Consensus Estimate and fell short of the year-ago quarter earnings by 0.7%.
Unum U.S. and Unum International results were soft. However, the company generated top line growth and recorded solid profit margins.
Operational Update
Total operating revenues of Unum Group were nearly $3 billion, up 2.2% year over year on higher premiums and increase in other income, partially offset by lower investment income. The top line however missed the Zacks Consensus Estimate by 0.8%.
Total benefits and expenses decreased 19.5% year over year to $2.7 billion. Lower benefits and a change in reserves for future benefit attributed to lower costs.
Unum Group Price, Consensus and EPS Surprise
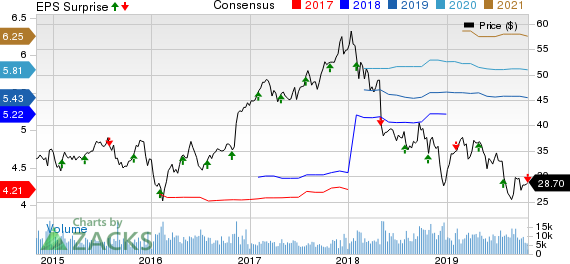
Unum Group price-consensus-eps-surprise-chart | Unum Group Quote
Quarterly Segment Update
Unum U.S.: Premium income was $1.5 billion, up 3.9% year over year. Adjusted operating income was down 3.5% year over year to $261.4 million, attributable to soft performance at Unum US as well as supplemental and voluntary line of business.
Unum International: Premium income grew 10.4% year over year to $152.3 million. Adjusted operating income was $24.2 million, down 7.3% year over year.
Unum UK line of business reported adjusted operating income, in local currency, of £18.7 million, down 6.5%. Premium income was £109 million, up 2.8%, driven by higher overall persistency, sales growth, and the impact of premium rate increases in the group long-term disability product line.
Benefit ratio was 73.4%, down 80 basis points (bps), reflecting favorable claims incidence in the group critical illness product line and lower inflation-linked increases in benefits, partially offset by unfavorable claim terminations in group long-term disability. Persistency increased in group long-term disability and group life business.
Colonial Life: Premium income increased 5% year over year to $419.9 million driven by growth in in-force block resulting from prior-year period sales growth. Sales decreased 0.2% to $120.6 million. Adjusted operating income increased 3.6% to $87.2 million.
Benefit ratio improved 10 bps year over year to 51.4% attributable to favorable experience in the life line of business, mostly offset by unfavorable experience in cancer and critical illness lines of business.
Closed Block: Premium income decreased 3.9% year over year primarily due to policy terminations and maturities. Adjusted operating income was $26.9 million, down 16.4% year over year.
Corporate: The segment incurred an operating loss of $48.9 million, wider than operating loss of $47.1 million in the year-earlier quarter.
Capital Management
As of Sep 30, 2019, the weighted average risk-based capital ratio for Unum Group’s traditional U.S. insurance companies was approximately 368%. Unum Group exited the quarter with cash and marketable securities worth $1 billion.
Book value per share of Unum Group increased 19.9% year over year to $46.70 as of Sep 30, 2019.
The company bought back 3.4 million shares for $100 million in the third quarter.
2019 Guidance
Unum Group affirmed after-tax operating income growth per share between 4% and 7%.
Zacks Rank
Unum Group currently carries a Zacks Rank #4 (Sell).
You can see the complete list of today’s Zacks #1 Rank (Strong Buy) stocks here.
Performance of Other Insurers
Third-quarter earnings of Aflac Incorporated (NYSE:AFL) , Employers Holdings (NYSE:EIG) and RLI Corp (NYSE:RLI) beat the respective Zacks Consensus Estimate.
Today's Best Stocks from Zacks
Would you like to see the updated picks from our best market-beating strategies? From 2017 through 2018, while the S&P 500 gained +15.8%, five of our screens returned +38.0%, +61.3%, +61.6%, +68.1%, and +98.3%.
This outperformance has not just been a recent phenomenon. From 2000 – 2018, while the S&P averaged +4.8% per year, our top strategies averaged up to +56.2% per year.
See their latest picks free >>
Unum Group (UNM): Free Stock Analysis Report
Aflac Incorporated (AFL): Free Stock Analysis Report
Employers Holdings Inc (EIG): Free Stock Analysis Report
RLI Corp. (RLI): Free Stock Analysis Report
Original post
Zacks Investment Research