It’s been almost two years since we shared our bullish stance on Bristol Myers (NYSE:BMY) stock. Shares in the pharmaceutical major were changing hands for less than $46 in April, 2019. The company had just announced its planned acquisition of Celgene (NASDAQ:CELG) for about $74 billion and Wall Street apparently didn’t like the risks involved.
However, the decline from the top at $77.12 a share in July, 2016, looked like a textbook Elliott Wave correction. Since the theory states that once a correction is over, the preceding trend resumes, we thought BMY was actually attractive below $50. Not to mention the fact that based on discounted future cash flows, the company was also undervalued.
In January, 2020, the price exceeded $68 a share. Then, the coronavirus crash gave investors another chance to join the bulls in the mid-$40s. Last week, Bristol Myers closed at $64.56, after reaching $67.13 on Tuesday. Can the rally continue this time around?

Fundamental valuation metrics suggest that even after a 45% surge, Bristol Myers is still undervalued. Management expects the company to average $15B a year in free cash flow going forward. Dividing its current market cap of $145B by $15B gives us a P/FCF lower than 10.
Approach Bristol Myers Stock With Caution Above $60
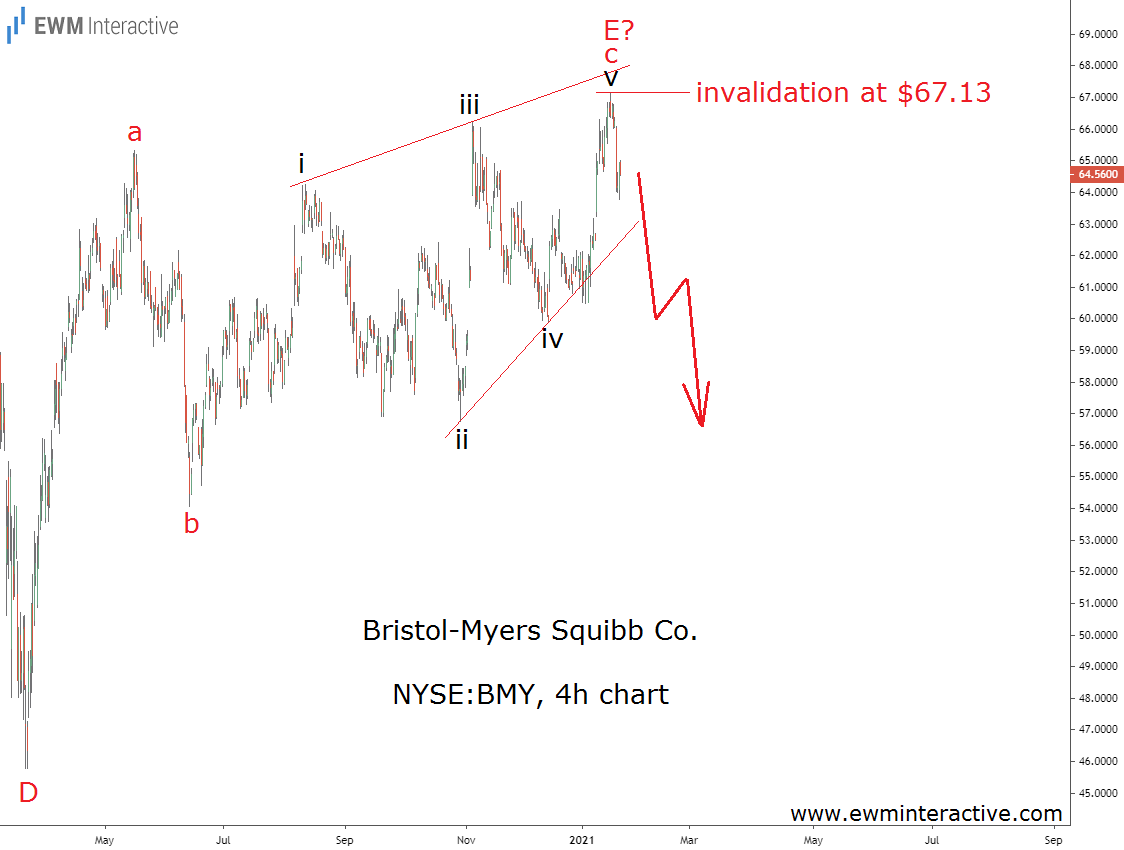
Unfortunately for the bulls, cheap stocks often get cheaper. The market is driven by emotions and cannot always be relied on to rationally value a business. The chart above, for instance, is giving us a good reason to be careful with Bristol-Myers near $65.
It shows the recovery from the March 2020 bottom at $45.76 to $67.13. It can easily be seen as a simple a-b-c zigzag, where wave ‘c’ is an ending diagonal. This is a corrective pattern, which means a notable bearish reversal can be expected. The next chart explains where does this structure fit into the bigger picture.

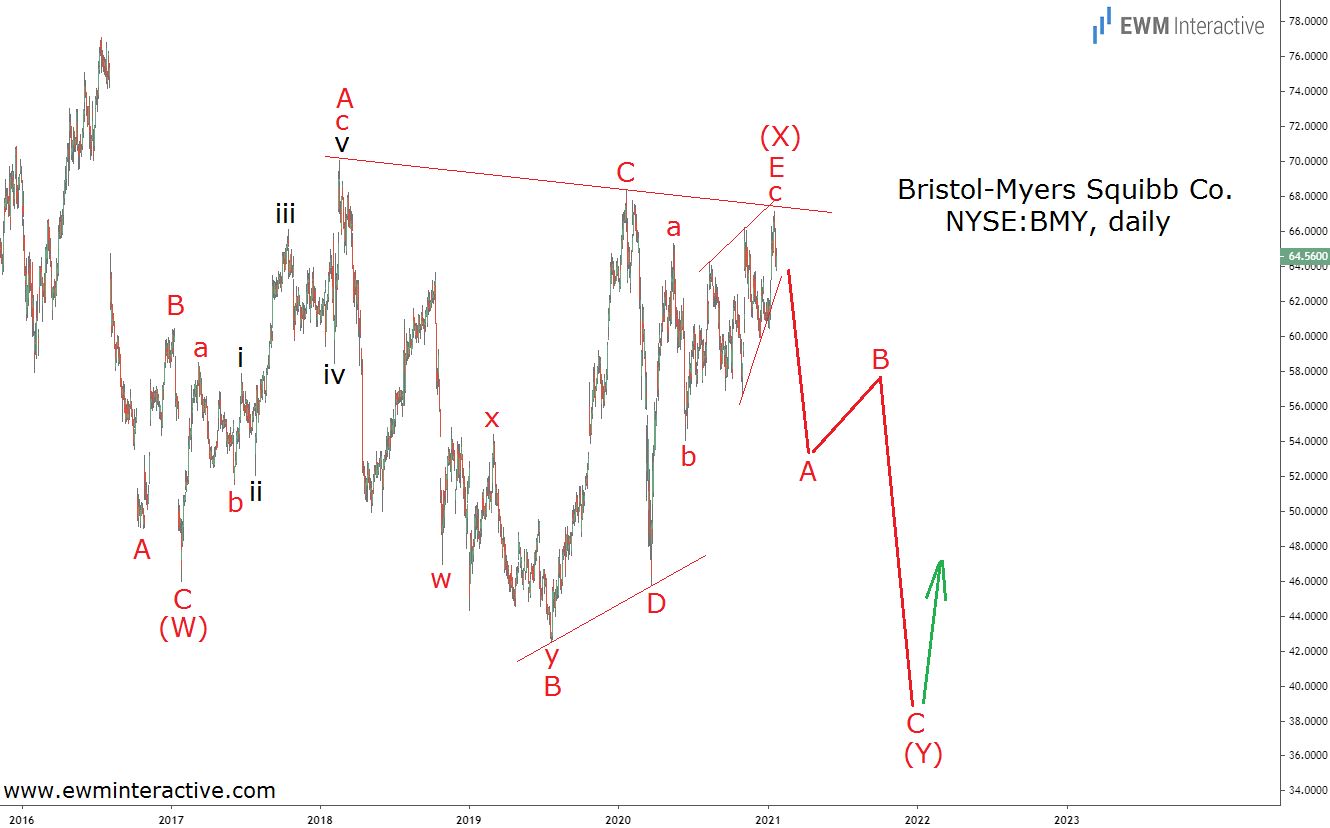
It turns out the decline from $77.12 in July, 2016, might still be in progress. For the past four years the stock price has been moving up and down in a narrowing range. “Triangle” is the first word that comes into mind when an Elliott Wave analyst sees something like that.
The weakness from $77.12 looks like an incomplete (W)-(X)-(Y) double zigzag, where wave (X) is a textbook triangle correction labeled A-B-C-D-E. If this count is correct, we can anticipate a ~40% plunge to sub-$40 a share in wave (Y). Once there, the post-2016 bear market should end and the risk/reward ratio would switch in favor of the bulls again.
