
UMB Financial (NASDAQ:UMBF) reported second-quarter 2019 net operating earnings of $1.17 per share, in line with the Zacks Consensus Estimate. The reported figure compares favorably with the prior-year quarter’s earnings of $1.12.
Higher revenues, aided by rising loans and deposit balances, supported the results. However, reduction in net interest margin was a major drag. Further, higher provisions and elevated expenses were the undermining factors.
Including certain non-recurring items, the company reported net income of $57 million or $1.16 per share for the reported quarter, up from the $55.4 million or $1.11 recorded in the prior-year quarter.
Increase in Revenues, Loans & Deposits Balance, Costs Flare Up
Total revenues for the April-June quarter came in at $271.8 million, up 8.5% year over year. The revenue figure also outpaced the Zacks Consensus Estimate of $270.7 million.
Net interest income came in at $166.4 million, reflecting an increase of 10.8% from the year-ago quarter. Increase in average loans and securities, along with an additional day in the quarter, mainly led to this upside. Net Interest Margin (NIM) contracted 5 basis points (bps) to 3.19% from the prior-year quarter reported tally.
Non-interest income totaled $105.4 million, up 5.1% year over year. This upside resulted from a rise in most of the income components, partly muted by lower bankcard fees and net losses on sales of securities available for sale.
Non-interest expenses (GAAP basis) came in at $193.4 million, up 9.1% from the year-ago tally, mainly due to rise in most of the expense components. Adjusted non-interest expenses were $193 million, down 9.4% year over year.
Efficiency ratio (GAAP basis) increased to 70.32% from the prior-year quarter’s 70.21%. Rise in efficiency ratio indicates decline in profitability. Adjusted efficiency ratio was 70.19%, up from the year-earlier quarter’s 69.88%.
As of Jun 30, 2019, average loans and leases were around $12.6 billion, up 2.4% sequentially. Additionally, average deposits climbed marginally from the prior-quarter’s end to $18.8 billion.
Credit Quality: A Mixed Bag
Total non-accrual and restructured loans came in at $53.4 million, down 4.6% year over year. However, provision for loan losses came in at $11 million, up from the $7 million recorded in the year-earlier quarter. Also, the ratio of net charge-offs to average loans was 0.40% in the reported quarter, up 8 bps from the year-ago quarter.
Strong Capital & Profitability Ratios
As of Jun 30, 2019, Tier 1 risk-based capital ratio was 12.65% compared with 13.56% as of Jun 30, 2018. Further, total risk-based capital ratio was 13.63% compared with 14.63% at the end of the prior-year quarter. Tier 1 leverage ratio was 9.69% compared with 10.50% as of Jun 30, 2018.
Adjusted return on average assets at the quarter’s end was 0.99%, down from 1.09% in the year-ago quarter. Additionally, return on average equity was 9.51% compared with 10.30% in the prior-year quarter.
Conclusion
UMB Financial put up a decent performance in the quarter. Organic growth is anticipated to continue, backed by higher revenues. Moreover, soaring loan balances will likely be a driving factor. Furthermore, the company’s efficiency ratio has been decent, which signals better profitability over the long run.
Nevertheless, elevated expenses and higher provisions may depress the company’s revenues. In addition, intense competition from other FinTech companies and online service providers is another concern.
UMB Financial Corporation Price, Consensus and EPS Surprise
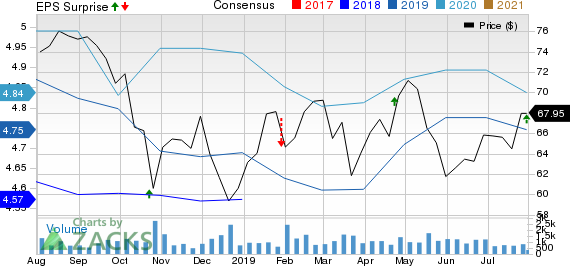
UMB Financial Corporation price-consensus-eps-surprise-chart | UMB Financial Corporation Quote
UMB Financial currently carries a Zacks Rank #3 (Hold). You can see the complete list of today’s Zacks #1 Rank (Strong Buy) stocks here.
Performance of Other Banks
Bank of Hawaii Corporation (NYSE:BOH) reported a positive earnings surprise of 2.2% in the April-June quarter, leading to an appreciation of 2.18% in shares, following the release. Earnings per share of $1.40 surpassed the Zacks Consensus Estimate of $1.37. Further, the reported figure compared favorably with $1.30 earned in the prior-year quarter.
Texas Capital Bancshares Inc. (NASDAQ:TCBI) delivered earnings per share of $1.50 in second-quarter 2019, lagging the Zacks Consensus Estimate of $1.53. Results, however, compared favorably with the prior-year quarter’s $1.38. Elevated expenses were on the downside. However, rise in revenues was a positive factor. Moreover, organic growth was reflected, with significant rise in loans and deposit balances.
Driven by top-line strength, Synovus Financial (NYSE:SNV) reported a positive earnings surprise of 1.01% during the June-end period. Adjusted earnings of $1.00 per share beat the Zacks Consensus Estimate of 99 cents. This apart, the reported figure came in 8.4% higher than the prior-year quarter tally. Higher revenues, backed by strong loan balances, stoked organic growth. Notably, lower efficiency ratio and rising fee income were tailwinds. Nonetheless, escalating expenses and provisions were undermining factors.
More Stock News: This Is Bigger than the iPhone!
It could become the mother of all technological revolutions. Apple (NASDAQ:AAPL) sold a mere 1 billion iPhones in 10 years but a new breakthrough is expected to generate more than 27 billion devices in just 3 years, creating a $1.7 trillion market.
Zacks has just released a Special Report that spotlights this fast-emerging phenomenon and 6 tickers for taking advantage of it. If you don't buy now, you may kick yourself in 2020.
Click here for the 6 trades >>
UMB Financial Corporation (UMBF): Free Stock Analysis Report
Synovus Financial Corp. (SNV): Free Stock Analysis Report
Texas Capital Bancshares, Inc. (TCBI): Free Stock Analysis Report
Bank of Hawaii Corporation (BOH): Free Stock Analysis Report
Original post
Zacks Investment Research