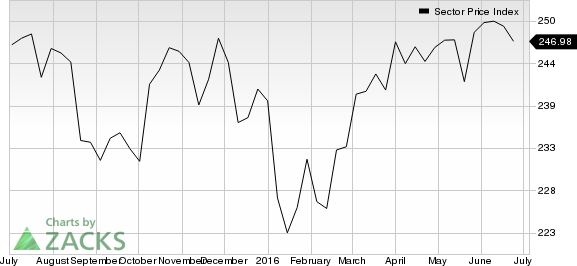
U.S. light-vehicle sales improved 1.5% year over year to 8.65 million units in the first half of 2016, per Autodata. This represents a new record for first-half sales results.
Sales increased 2.5% year over year to 1.5 million units in Jun 2016. However, sales on a seasonally adjusted annualized rate (“SAAR”) basis declined to 16.68 million units in the month from 17.46 million units in May 2016 and 17.01 million units in Jun 2015.
Product segments like trucks and utility vehicles recorded higher sales in June. However, car sales declined in the month.
General Motors Company (NYSE:GM) was the leader in terms of sales volume for Jun 2016. Among the six major American and Japanese automakers, Nissan Motor Co. Ltd. (OTC:NSANY) recorded the maximum year-over-year sales improvement in the month.
Now, let us take a look at the U.S. sales figures reported by individual automakers.
U.S. Automakers
General Motors recorded 255,210 vehicle sales in June, marking a 1.6% year-over-year decrease. While retail sales improved 1.2%, commercial deliveries fell 7%. Sales in the first half of 2016 declined 4.4% year over year to 1.44 million units.
Ford Motor Co. (NYSE:F) reported a 6.4% increase in U.S. sales from the year-ago period to 240,109 vehicles in Jun 2016. Sales volume of the Lincoln brand vehicles advanced 5.8% year over year to 8,809 units in the month. Sales of the Ford brand improved 6.4% year over year to 231,300 vehicles. In the first half of 2016, Ford’s sales increased 4.6% year over year to 1.35 million units.
FCA US LLC – controlled by Fiat Chrysler Automobiles (NYSE:F) – recorded a 7% year-over-year rise in sales to 197,073 vehicles in Jun 2016. This marks the best June sales for the group since 2005. Sales increased 6% year over year to 1.15 million units in the first half of 2016.
Japanese Automakers
Toyota Motor Corporation’s (NYSE:TM) sales dropped 5.6% year over year to 198,257 units in Jun 2016. Sales at the Toyota division declined 6.2% to 172,478 units. Lexus’ sales fell 1.3% to 25,779 units. Toyota’s sales also declined 2.7% to 1.2 million units in the first half of 2016.
Honda Motor Co., Ltd. (NYSE:HMC) recorded a 3.2% year-over-year increase in sales to 138,715 vehicles in the month. Sales in the Honda Division went up 7.1% to 127,363 units. Further, sales of the Acura Division fell 26.9% to 11,352 vehicles. In the first half of 2016, Honda recorded a 5.2% year-over-year increase in sales to 792,355 vehicles.
Nissan reported a 13.1% year-over-year improvement in sales to a record 140,553 vehicles in June. Sales in the Nissan division increased 13.4% to 129,495 units, also a record. Further, sales of the Infiniti Division went up 10.7% to 11,058 units. In the first half of the year, sales increased 8.4% to 798,114 units.
Outlook
U.S. auto sales are expected to improve in the second half of 2016, backed by high employment levels, rising personal income, stable fuel prices and easy availability of credit. Moreover, the high average age of cars on the U.S. roads should continue to boost replacement demand for cars.
However, the pressure to maintain the attractive incentives and deals may strain the margins for automakers. Also, many analysts believe that auto sales are reaching a plateau, which is resulting in slow growth.
Nevertheless, the U.S. auto sector looks set for a good year. Strong auto sales also bode well for the overall U.S. economy as the automobile industry is a major contributor to economic growth.
FORD MOTOR CO (F): Free Stock Analysis Report
HONDA MOTOR (HMC): Free Stock Analysis Report
TOYOTA MOTOR CP (TM): Free Stock Analysis Report
NISSAN ADR (NSANY): Free Stock Analysis Report
FIAT CHRYSLER (FCAU): Free Stock Analysis Report
GENERAL MOTORS (GM): Free Stock Analysis Report
Original post
Zacks Investment Research

