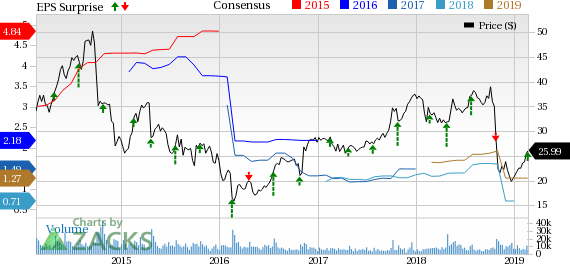
Trinity Industries, Inc. (NYSE:TRN) delivered impressive fourth-quarter 2018 results, with earnings and revenues beating the Zacks Consensus Estimate.
The company’s earnings (excluding 7 cents from non-recurring items) of 26 cents per share outpaced the Zacks Consensus Estimate by 3 cents. However, the bottom line declined on a year-over-year basis primarily due to high costs.
Total revenues came in at $735 million, which surpassed the consensus mark of $673.2 million. Strong segmental performance boosted top-line results.
Segmental Results
Till third-quarter 2018 results, Trinity reported through five segments — Rail Group, Construction Products Group, Inland Barge Group, Energy Equipment Group as well as Railcar Leasing and Management Services Group. Post the completion of spin-off transaction with its infrastructure-related businesses — Acrosa — on Nov 1, 2018, the company currently reports through three segments — Railcar Leasing and Management Services Group, Rail Products Group and All Other Group.
The Railcar Leasing and Management Services Group generated revenues of $227.3 million, up 15.3% year over year. Segmental operating profit came in at $96 million, down 25.1% on a year-over-year basis. The downside was caused by higher depreciation expenses related to growth of lease fleet and change in mix of railcars sold from the lease fleet. Nevertheless, the company’s lease fleet came in at 99,215 units as of Dec 31, 2018. The fleet size grew 12% compared with the figure at the end of 2017.
Revenues in the Rail Products Group totaled $694.7 million, up 8.9% from the prior-year quarter’s tally. Segmental operating profit came in at $44.1 million, down 39.9% from the prior-year quarter’s figure. Operating profit declined due to lower volume, product mix changes and pricing pressures. Notably, the group delivered 5,285 railcars and received orders for 8,045 railcars compared with 6,150 and 3,180 in the year-ago quarter, respectively.
Revenues in the All Other Group grossed $89.7 million, up 11.7% year over year. The upside can be attributed to higher volumes in highway products businesses. Segmental operating profit came in at $7.9 million in the quarter under review, against a loss of $1.7 million in the year-ago quarter. Lower litigation expenses and insurance recoveries associated with the damage previously recovered at two highway manufacturing facilities led to this upside.
Liquidity & Share Repurchases
This Zacks Rank #3 (Hold) company exited 2018 with cash and cash equivalents of $179.2 million compared with $778.6 million at the end of 2017. Meanwhile, debt totaled $4,029.2 million as of Dec 31, 2018 compared with $3,241.9 million as of Dec 31, 2017. You can see the complete list of today’s Zacks #1 (Strong Buy) Rank stocks here.
During the fourth quarter, Trinity repurchased 12.9 million shares for approximately $280 million.
2019 Outlook
For 2019, Trinity maintains its projection for total earnings per share (EPS) in the range of $1.15-$1.35, whose mid-point of $1.25 is below the current Zacks Consensus Estimate of $1.27. Interest expense is projected to be around $225 million. Moreover, tax rate is estimated at 27%.
The company anticipates segmental revenues in Railcar Leasing and Management Services Group in the range of $770-$785 million. Segmental operating profit is estimated in the range of $310-$320 million. Furthermore, net lease fleet investment in the segment is anticipated in the range of $1.2-$1.4 billion in 2019.
Revenues in the Rail Products Group are in the range of $3.1-$3.3 billion. Segmental operating margin is projected in the range of 9-9.5%. The segment also maintains projections related to deliveries between 23,500 and 25,500 railcars in 2019.
Also, operating profit in All Other Group is projected around $10 million.
Upcoming Releases
Investors interested in the Zacks Transportation Sector are keenly awaiting fourth-quarter 2018 earnings reports from key players like Azul S.A. (NYSE:AZUL) , Frontline Ltd. (NYSE:FRO) and GOL Linhas Aéreas Inteligentes S.A. (NYSE:GOL) . Frontline and GOL Linhas are scheduled to report fourth-quarter results on Feb 28. Azul will release the same on Mar 14.
Today's Best Stocks from Zacks
Would you like to see the updated picks from our best market-beating strategies? From 2017 through 2018, while the S&P 500 gained +15.8%, five of our screens returned +38.0%, +61.3%, +61.6%, +68.1%, and +98.3%.
This outperformance has not just been a recent phenomenon. From 2000 – 2018, while the S&P averaged +4.8% per year, our top strategies averaged up to +56.2% per year.
See their latest picks free >>
Gol Linhas Aereas Inteligentes S.A. (GOL): Free Stock Analysis Report
Trinity Industries, Inc. (TRN): Free Stock Analysis Report
Frontline Ltd. (FRO): Free Stock Analysis Report
AZUL SA (AZUL): Free Stock Analysis Report
Original post
Zacks Investment Research

