Technical Outlook:
- S&P 500 (SPX) sold off hard and early yesterday, only to see a strong rally, just prior to the FOMC minutes being released, that lasted into the closing bell.
- Despite the rally, the Russell 200 (RUT) was lower and weighed heavily on a large number of stocks yesterday.
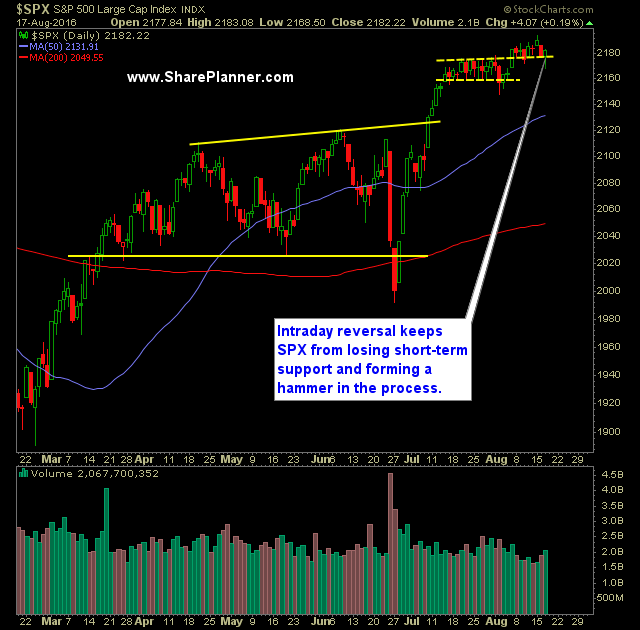
- The 20-day moving average was broken intraday, but the bulls managed to still close above it with a solid hammer candle. Also the 10-day moving average was held on to.
- Strong possibility, if the market manages to rally today, that it forms a morning star pattern.
- Yesterday marked nine straight days of alternating up/down on SPDRs S&P 500 (SPY (NYSE:SPY)). We are getting close to a record and is the third time in the past year we have been on one of these streaks, which in and of itself is unusual.
- Notable pick up in volume on SPY yesterday vs anything seen over the previous three trading sessions. Nonetheless, still below recent averages.
- VIX was crushed yesterday as well, having risen almost to 14, only to drop 3.6% on the day and close at 12.19. It was unable to push through and sustain a move above resistance at 13.
- Oil continues to climb higher, but the market, just like during its recent downturn, refuses to follow. Over the last three months there has been a notable disconnect between equities and the price of crude.
- Two gaps on the SPY 30 minute chart remains unfilled. Otherwise the price is extremely choppy.
- Key support today will be 2171 followed by 2155. Even a break of the former should require traders to reduce their expectations for the market going forward.
- SPX has not seen a +/- 1% move in either direction since July 8, 2016. Since then the market has moved higher but in very small increments and tight daily ranges.
- Dow Jones Industrial Average (DJIA) is keeping the double top pattern in play here. However it is coiling just underneath resistance which leads me to believe it wants to break through.
- The bulk of the earnings season is behind us. No significant disasters from the big names that reported that negatively impacted the market as a whole.
- Overall, August is the worst performing month for the Dow Jones 30 and S&P 500.
- At this point, and with the election ahead, I'd expect the market to keep rallying higher. I don't expect there to be a rate hike between now and the election. To do so would impact the market and thereby the election. I don't think the Fed wants that, particularly since Trump has indicated that he would replace Yellen.
My Trades:
- Added 3 new long positions yesterday.
- Sold Adobe Systems Incorporated (NASDAQ:ADBE) yesterday at $99.69 for a 0.7% profit.
- Sold CarMax Inc (NYSE:KMX) yesterday at $58.60 for a 1.1% loss.
- Sold PulteGroup Inc (NYSE:PHM) yesterday at 29.97 for a 2.6% loss.
- May add 1-2 new swing-trades to the portfolio today.
- Will consider adding additional short positions to the portfolio as the market warrants it.
- Currently 60% Long / 10% Short / 30% Cash

