Get 40% Off
👀 👁 🧿 All eyes on Biogen, up +4,56% after posting earnings. Our AI picked it in March 2024.
Which stocks will surge next?
Unlock AI-picked Stocks

The Market Barometer Suggests Serious Volatility As Summer 2017

Published 04/30/2017, 06:20 AM
Updated 07/09/2023, 06:31 AM

Markets are rather quite in recent weeks. Is that a new trend or the calm before the storm?

As the month of April comes to an end, the month-to-date returns on key assets are almost neutral. Against April 1st, the S&P 500 is up 1.2 percent (from 2350 to 2380 points), gold is up 1.3 percent (from 1250 to 1269 points), crude oil is down 2.3 percent (from 51 to 49.19 points), the U.S. dollar is down 1.4 percent (from 100.30 to 98.90 points) and 10-Year Yields are down 2.3 percent (from 23.4 to 22.8 points).

The neutral view in markets is confirmed by InvestingHaven’s market barometer, a view on markets that is created by its research team.

The market barometer looks at leading assets: how they trade compared their longer term trend (moving average), against each other, gives a unique perspective on ongoing trends.

Right now, most key assets are neutral. the U.S. dollar, gold and the Yen, as fear assets or safe haven assets, are trading almost exactly on their longer term trend.

The S&P 500 and Yields are slightly positive. Given stock markets trading at all-time highs, and some 7 percent above their long term trend, the question is how much upside potential is left.
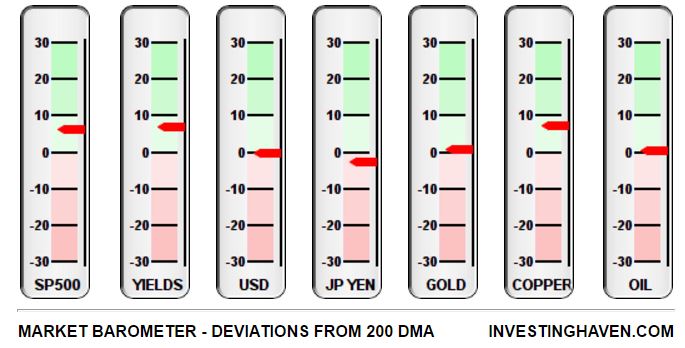
Market Barometer Key Assets

In order to answer that last question, we look at 20-year Yields. That is a leading indicator for stock markets, as well as several risk assets. Its long term chart suggests that it is very close to a major peak within its decade long trend (pattern). It can peak between 3.0 and 3.1 points, which is 15 percent above today’s level. Note that 3.0 in 20-year Yields points to ‘minimum fear’.

3rd party Ad. Not an offer or recommendation by Investing.com. See disclosure here or remove ads .

There are two scenarios going forward.

Either Yields will reverse their 4-decade long pattern, leading to disruption in stock and bond markets. That would be huge news, and the price level to watch is 3.1 points in 20-year Yields.

Either Yields go lower after touching 3.0 points, which would indicate that markets go in risk-off mode. Stocks would suffer, safe haven assets would become bullish.
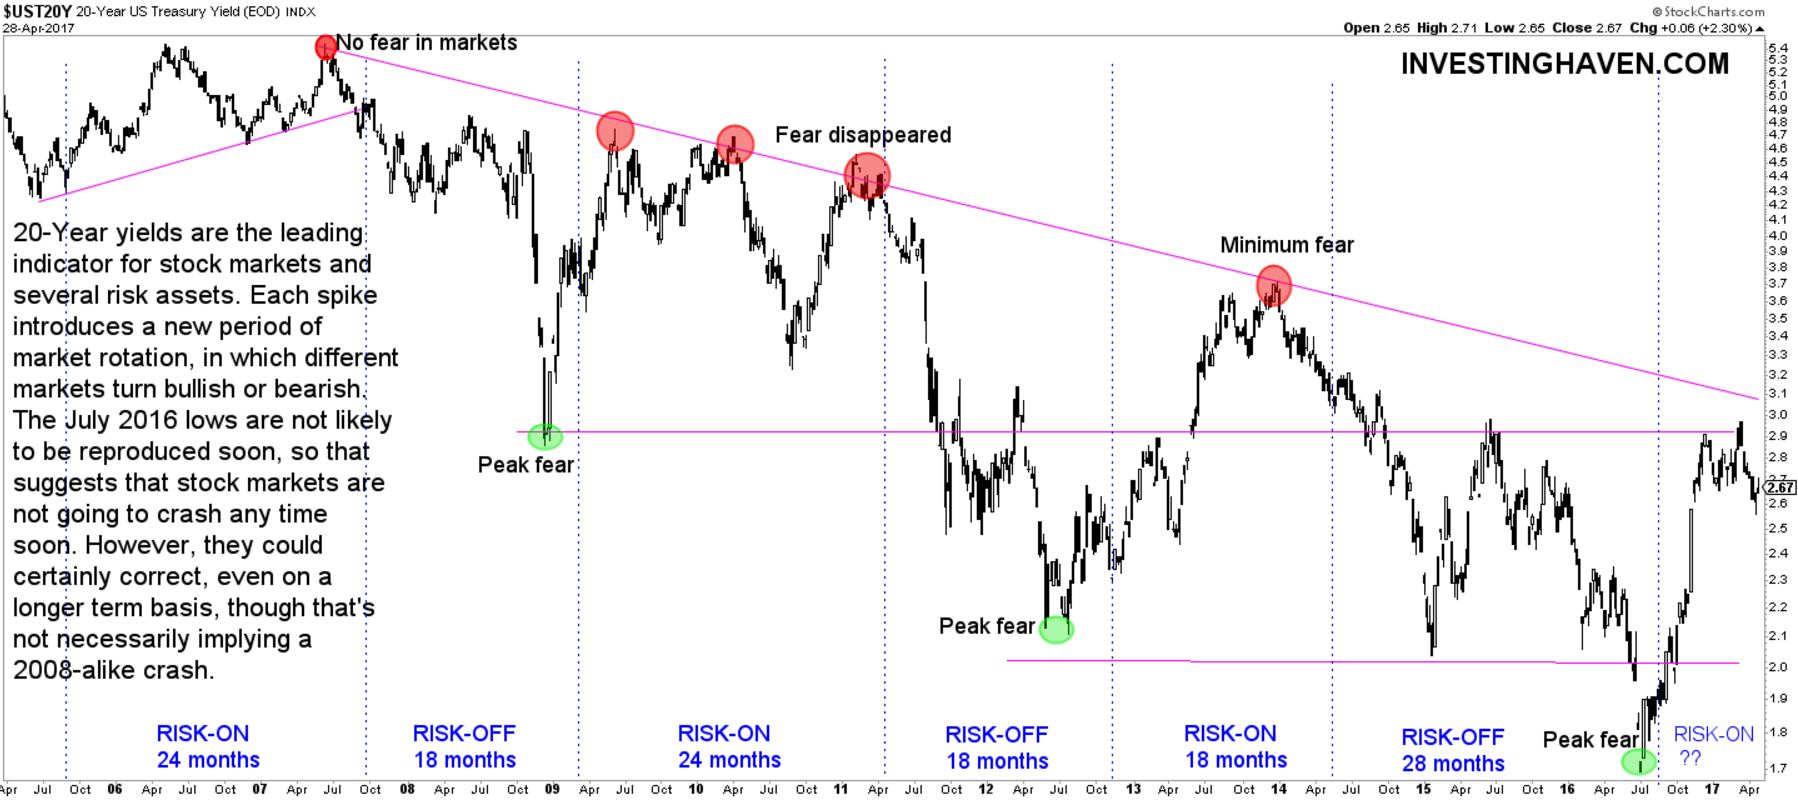
UST 20Y

Given extreme low volatility, even on a 3-decade basis, we believe the Spring of 2017 will be quiet, but volatility will pick around summer time, only to bring stocks seriously down in September / October of this year. That could indicate the end of the ongoing ‘risk-on’ mode. That could bring a meaningful buy signal for gold and silver.
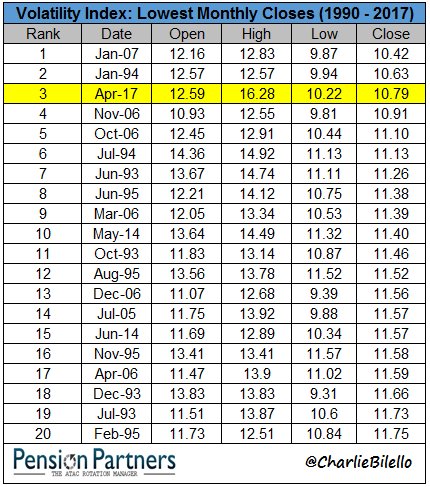
Volatility Index Lows Decades

Original post

Latest comments

Risk Disclosure: Trading in financial instruments and/or cryptocurrencies involves high risks including the risk of losing some, or all, of your investment amount, and may not be suitable for all investors. Prices of cryptocurrencies are extremely volatile and may be affected by external factors such as financial, regulatory or political events. Trading on margin increases the financial risks.
Before deciding to trade in financial instrument or cryptocurrencies you should be fully informed of the risks and costs associated with trading the financial markets, carefully consider your investment objectives, level of experience, and risk appetite, and seek professional advice where needed.
Fusion Media would like to remind you that the data contained in this website is not necessarily real-time nor accurate. The data and prices on the website are not necessarily provided by any market or exchange, but may be provided by market makers, and so prices may not be accurate and may differ from the actual price at any given market, meaning prices are indicative and not appropriate for trading purposes. Fusion Media and any provider of the data contained in this website will not accept liability for any loss or damage as a result of your trading, or your reliance on the information contained within this website.
It is prohibited to use, store, reproduce, display, modify, transmit or distribute the data contained in this website without the explicit prior written permission of Fusion Media and/or the data provider. All intellectual property rights are reserved by the providers and/or the exchange providing the data contained in this website.
Fusion Media may be compensated by the advertisers that appear on the website, based on your interaction with the advertisements or advertisers.
© 2007-2024 - Fusion Media Limited. All Rights Reserved.