The relationship between the dollar and the S&P 500 is a perennial concern for investors. Analysts, including ourselves, run correlations.
There are different ways to conduct the correlations. We will typically run our correlations on the basis of percent change in each variable because that is ultimately what investors are interested in: the correlation of returns.
We recently showed such a measure of correlation actually showed that over the past 60 days, the correlation between the euro-dollar exchange rate and the S&P 500 has actually been trending up since early February when it dipped below 0.25. It is near 0.41 now. The 30-day correlation is near 0.59, suggesting that in the most recent period, the correlation has gotten tighter.
However, another approach is being played up in the media. Rather than look at the euro, it looks at the Dollar Index. The Dollar Index is a basket of currencies heavily weighted to the euro and currencies, like the Swiss franc, Swedish krona, and the British pound, which move in the euro's orbit. These components account for a full three-quarters of the Dollar-Index basket.
The remainder is the Canadian dollar (9.1%) and the yen (13.65). Two of the four largest US trading partners, namely Mexico and China, are not even included. Simply put, the Dollar Index is not a trade weighted basket, but a largely speculative vehicle.
Yet the real problem with the popular approach is that it either eyeballs a correlation, which is a statistical relationship, or it uses a less rigorous methodology to demonstrate what it assumes to be the case. Conducting the correlation on the basis of level rather than (percentage change) is not very rigorous. Such an approach lends itself to spurious correlations as it makes two trending markets correlated when they are not.
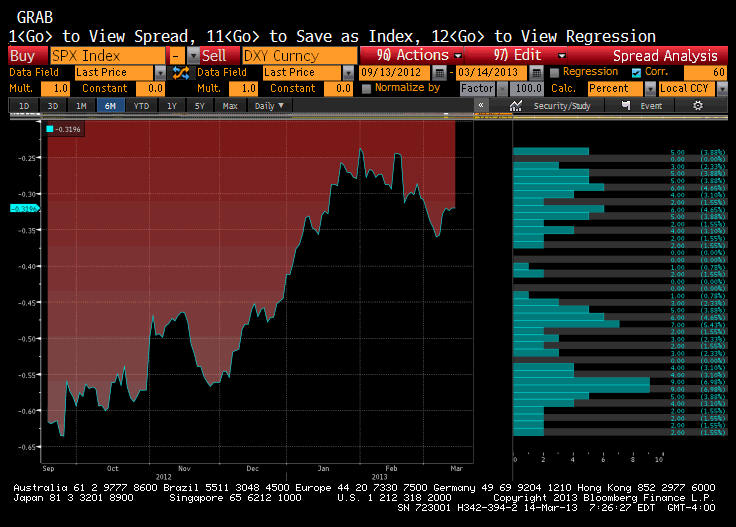
Here is what the different methodologies yield. The charts are generated on Bloomberg. The first shows the results of our methodology--the correlation between the Dollar Index and the S&P 500 on a 60-day rolling basis on the percentage change--over the past year. The take away is the correlation is still inverse, though clearly less than a year ago.
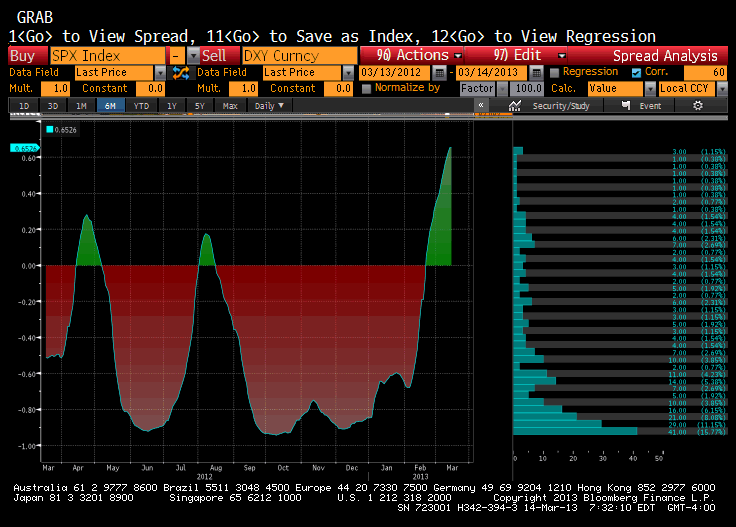
This second chart is done in the way that has been shown in some of the financial press. It is the same rolling 60-day period, but rather than percentage change, it runs the correlation on the level of the Dollar Index and the level of the S&P 500. Its shows two other periods in the past year where the correlation was positive, though not as much as currently. These were false positives, if you will.. 
Mathematically, our methodology is regarded as more rigorous and addresses what is important to investors- the correlation of returns not simply levels. We need to distinguish between two time series that sometimes trend in the same direction from a two time series whose returns are correlated.
Beware of false prophets profits.
- English (UK)
- English (India)
- English (Canada)
- English (Australia)
- English (South Africa)
- English (Philippines)
- English (Nigeria)
- Deutsch
- Español (España)
- Español (México)
- Français
- Italiano
- Nederlands
- Português (Portugal)
- Polski
- Português (Brasil)
- Русский
- Türkçe
- العربية
- Ελληνικά
- Svenska
- Suomi
- עברית
- 日本語
- 한국어
- 简体中文
- 繁體中文
- Bahasa Indonesia
- Bahasa Melayu
- ไทย
- Tiếng Việt
- हिंदी
The Dollar And S&P 500 Relationship Re-Examined
Published 03/15/2013, 01:07 AM
Updated 07/09/2023, 06:31 AM
The Dollar And S&P 500 Relationship Re-Examined
Latest comments
Loading next article…
Install Our App
Risk Disclosure: Trading in financial instruments and/or cryptocurrencies involves high risks including the risk of losing some, or all, of your investment amount, and may not be suitable for all investors. Prices of cryptocurrencies are extremely volatile and may be affected by external factors such as financial, regulatory or political events. Trading on margin increases the financial risks.
Before deciding to trade in financial instrument or cryptocurrencies you should be fully informed of the risks and costs associated with trading the financial markets, carefully consider your investment objectives, level of experience, and risk appetite, and seek professional advice where needed.
Fusion Media would like to remind you that the data contained in this website is not necessarily real-time nor accurate. The data and prices on the website are not necessarily provided by any market or exchange, but may be provided by market makers, and so prices may not be accurate and may differ from the actual price at any given market, meaning prices are indicative and not appropriate for trading purposes. Fusion Media and any provider of the data contained in this website will not accept liability for any loss or damage as a result of your trading, or your reliance on the information contained within this website.
It is prohibited to use, store, reproduce, display, modify, transmit or distribute the data contained in this website without the explicit prior written permission of Fusion Media and/or the data provider. All intellectual property rights are reserved by the providers and/or the exchange providing the data contained in this website.
Fusion Media may be compensated by the advertisers that appear on the website, based on your interaction with the advertisements or advertisers.
© 2007-2024 - Fusion Media Limited. All Rights Reserved.
