Get 40% Off
🚨 Volatile Markets? Find Hidden Gems for Serious OutperformanceFind Stocks Now

Tesla’s Rally Continues As Expected, But Downside Risk Increasing

Published 08/20/2020, 02:26 PM
Updated 07/09/2023, 06:31 AM

Over the last few weeks, I have kept your updated on what Tesla (NASDAQ:TSLA) would most likely do. See my articles here and here.

In summary, I forecasted:

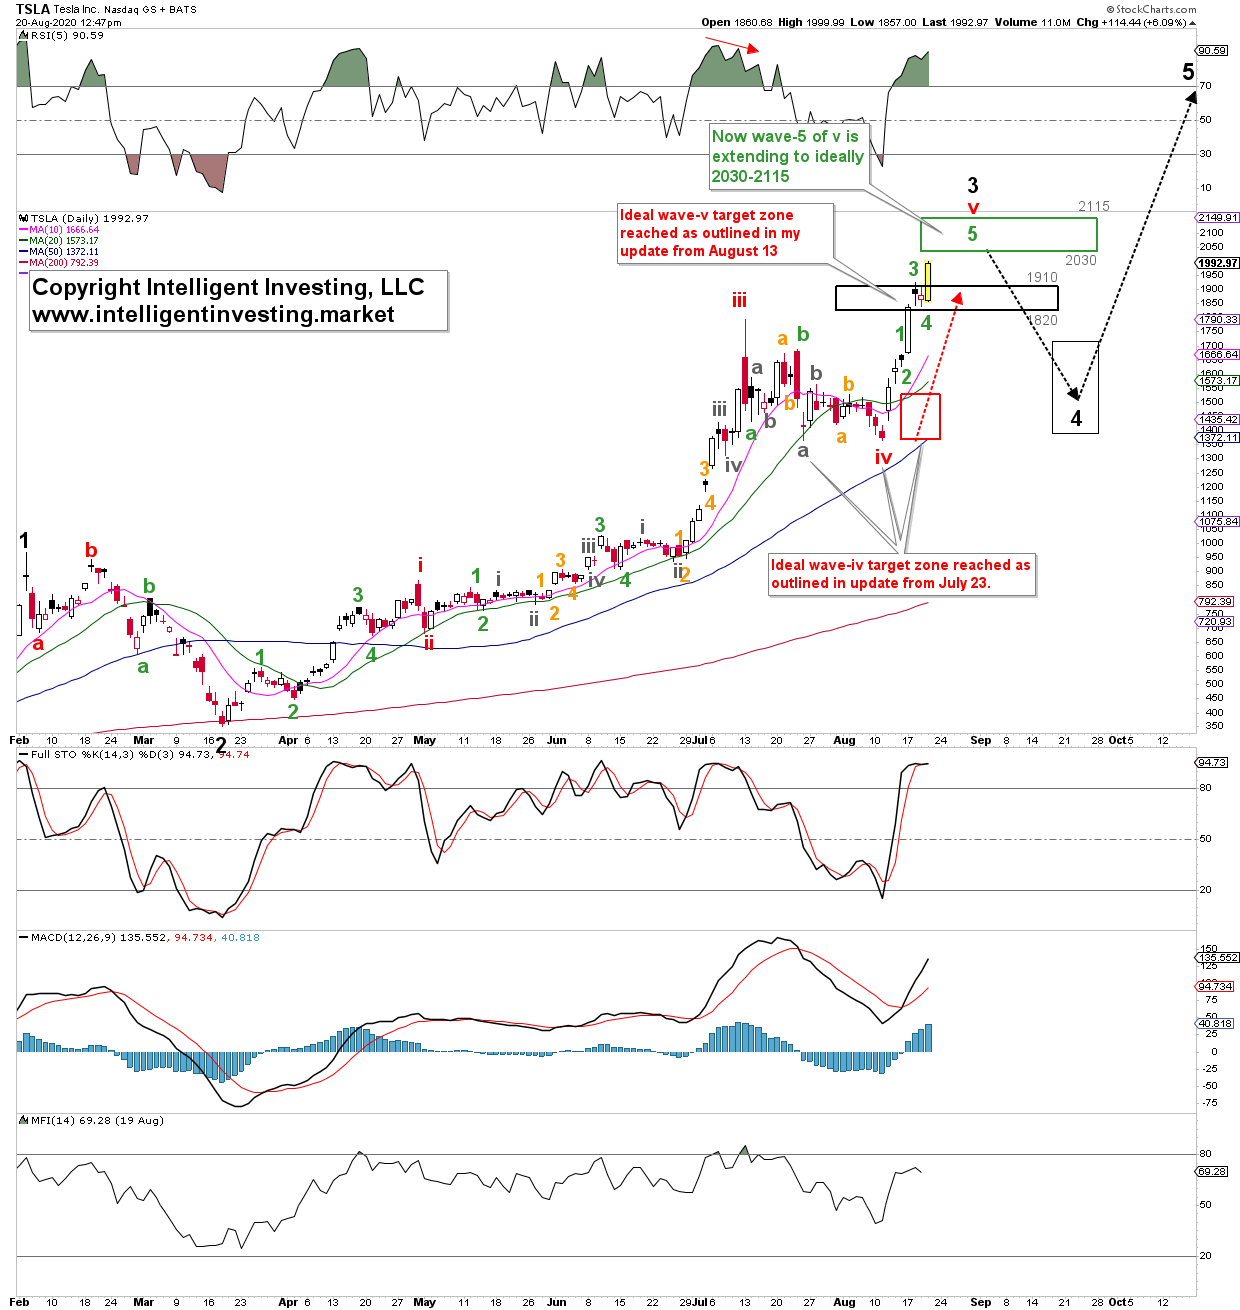
Tesla should bottom at, ideally, around $1,369-1,320, and from there rally to, ideally, $1,820-1,910.

One month later, my upside target has even been surpassed. Bonus!

Now, I do not get my calls always right, nobody does, but these mini-series shows the power of the Elliott Wave Principle when applied correctly. The track record is too good even to consider markets and stocks move randomly, on the news, and/or cannot be forecasted—quite the opposite. There is method to the madness.

So, where does that leave Tesla now? And why did its stock move above the initial upside target zone of $1,820-1,910?

Well, red wave-v is extending. When a new wave starts, be it up or down, one cannot know beforehand if it will extend, i.e., become longer than “normal” or not. “Normal” in this case means the typical/textbook/standard Fibonacci-based relationship between 1st and 5th waves (in this case red wave-i and v): wave-v is 1.00x wave-i, but it can be shorter (0.5 to 0.764x or longer 1.236 to 1.618+ times). Currently, it is longer, because red wave-v is subdividing into five smaller (green) waves, with -IMHO- green wave-5 now under way. Applying the same Fibonacci-extension technique for this green wave-5 as for the one degree larger red wave-v, it should typically top out between the 0.764-1.00x extension of green wave-1: $2030-2115. Of course, wave-5 can also extend. Then, we have an extension within an extension on our hands. To be determined.

3rd party Ad. Not an offer or recommendation by Investing.com. See disclosure here or remove ads .

Figure 1: TSLA daily chart.

Tesla Daily Chart.

How could one have traded this rally successfully using my work? Since I put my money where my mouth is, I went long TSLA on Aug. 12 at $1,548, with an initial stop at the then-tentative wave-iv low ($1,365). This gave me 11.8% downside risk and 23.4% upside potential ($1,365 vs $1,910). A 1:2 risk/reward ratio. One should take that at any time.

I then sold half of my position at $1,615 on Aug. 13, and raised the stop to $1,567 (that day’s low), guaranteeing a winning trade already. On Aug. 14, I sold another fourth at $1,665 and raised the stop at the end of the day to $1,626 (day’s low). On Aug. 17, I sold another eighth at $1,816 as the price was very close to the $1,820-1,910 upside target. I then placed a 5% trailing stop on the remaining eighth of my position, which I still have. Thus, my trade has so far netted me +10%.

Not bad for a week’s work. You can follow these trades via my hedge fund’s trading service: northpostpartners.com. Why did I not hold the entire position all along? Because my analyses can always be wrong. Trading and forecasting are two different things. I used my forecasting skills to determine the next low-risk-high-reward trade, and then I used appropriate trading techniques to make money: sell into strength, move stops up, get a guaranteed winning trade and then let the rest ride for as high as it can go. Thus, I am still exposed to Tesla, albeit only one-eighth of a position, but I am exposed nonetheless, and I have absolute zero risk at this stage: It is all house money now. In the end, it's only about making money. It is not about who can hold an individual stock the longest. And as long as you consistently make money, then the markets are a fun place to be in. But that requires access to excellent forecasting and proven trading techniques. One does not jump in and hope for the best. Hope is not a strategy.

3rd party Ad. Not an offer or recommendation by Investing.com. See disclosure here or remove ads .

Latest comments

I counted an extension to around 2280, and that might have made it. Let’s see now.
Quite wonderful work. I´m really glad that I´ve found you EWT analyzes.
thank you!
This guy is a real genius!
anybody who buys at 2k deserves to lose money. has the company even posted a profit ever?
4 consecutive quarters profit, maybe you better stick to what you are good at, probably trading GE GM IBM CSCO you know the boring old stocks that don't move hahahahaha lmao!! 🤣🤣🤣
 OMG! 4 consecutive quarters!!!!!!!!!!! you mean in a row!!!! i dont think any company in history has had such a streak!! oh wait! your information is deceptive ... tesla actually LOST 862 MILLION DOLLARS in 2019 .... to date they have lost around 5 BILLION dollars!!!!!!! maybe you should stick to what you know ... making emojis
this shows fundamentals mean very little for stock prices. the only thing that matters most is... drum role please... the stock's actual price. trade its patterns and trend: up is up, down is down. Know when the exit! everything else is just opinion and opinion makes 0 profit. don't confuse opinion with what a stock should or should not do. it does what it does. EWT tells you. simple
I sold early at 1800 on Monday.  Thought it was overextending itself but boy was I wrong.  However, I did think it would pull back to around 1700 eventually and your analysis seems to be pretty close with that forecast.  I will wait for the pullback to the low 1700s before loading up again.
Might be closer then we think since Tesla moved into the 2030 range today already.
 Hi Tom, don't beat yourself up on a good trade. Profit is profit! Kudos! Most people lose money in the markets so you are better than most. Now analyze why you sold. Was it based on opinion (oh it is overbought) or based on factual analyses? Likely, in your case, the former. Never sell or buy based on opinion. Only trigger trades based on hard evidence: price levels. Go over your trading system and improve it. All the best!
 I was in that position since 900.  The whole thing was flashing alarm bells like back when it tried to push 1000 for the first time which is why I sold. Not really beating myself, just amazed at the legs this rally has on nothing more than stock split news.  The rest of the market isn't showing the strength I would like for me to stay in a long position right now.  I could be wrong but my analysis is showing a strong chance of a market correction ahead so I will stay in mostly cash for now.  My charting shows a breakout possible within the next 7 days.  The million dollar question for me is what will happen next week if unemployment ticks up again and Congress still can't reach a deal?
thanks for your analysis, i appreciate it. Your charts have been very helpful. Thank you Dr!
Hi Mike, awesome! glad to hear.
Thanks for your insights, good stuff 😎👍
Thank you! On to next week :-)
Risk Disclosure: Trading in financial instruments and/or cryptocurrencies involves high risks including the risk of losing some, or all, of your investment amount, and may not be suitable for all investors. Prices of cryptocurrencies are extremely volatile and may be affected by external factors such as financial, regulatory or political events. Trading on margin increases the financial risks.
Before deciding to trade in financial instrument or cryptocurrencies you should be fully informed of the risks and costs associated with trading the financial markets, carefully consider your investment objectives, level of experience, and risk appetite, and seek professional advice where needed.
Fusion Media would like to remind you that the data contained in this website is not necessarily real-time nor accurate. The data and prices on the website are not necessarily provided by any market or exchange, but may be provided by market makers, and so prices may not be accurate and may differ from the actual price at any given market, meaning prices are indicative and not appropriate for trading purposes. Fusion Media and any provider of the data contained in this website will not accept liability for any loss or damage as a result of your trading, or your reliance on the information contained within this website.
It is prohibited to use, store, reproduce, display, modify, transmit or distribute the data contained in this website without the explicit prior written permission of Fusion Media and/or the data provider. All intellectual property rights are reserved by the providers and/or the exchange providing the data contained in this website.
Fusion Media may be compensated by the advertisers that appear on the website, based on your interaction with the advertisements or advertisers.
© 2007-2024 - Fusion Media Limited. All Rights Reserved.