
Teladoc Health, Inc. (NYSE:TDOC) reported fourth-quarter 2019 loss of 26 cents per share, narrower than the Zacks Consensus Estimate of loss of 33 cents per share.
The reported figure was also narrower than the year-ago quarter’s loss of 35 cents per share. The improvement was primarily due to strong revenue growth, stemming from increased demand for the company’s service offerings.
Teladoc Health, Inc. Price, Consensus and EPS Surprise
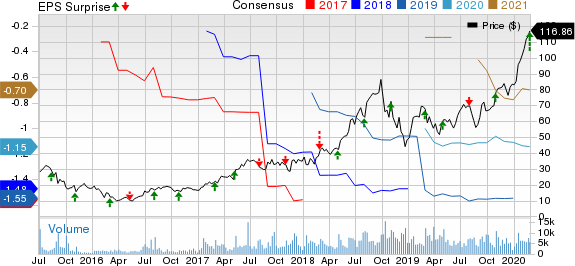
Teladoc Health, Inc. price-consensus-eps-surprise-chart | Teladoc Health, Inc. Quote
Behind the Headlines
The company’s operating revenues of $156 million surpassed the Zacks Consensus Estimate by 1.76% and rose 26.8% year over year. The upside can be attributed to the strong performance of its revenue components — subscription access fees and visit fees.
Revenues from subscription access fees (which comprised 81% of total revenues) increased 24% year over year to nearly $127 million. Within this, subscription fees from the United States accounted for $98.1 million or 77% of total access fees (up 25% year over year), while international subscription fees accounted for the remaining 23% or $28.9 million (up 19%).
The company generated $29.5 million in visit fee revenues from general and medical visits, representing an increase of 47% year over year.
Gross margin declined to 64.6% from 67.4% in the year-ago quarter as a result of an overall revenue mix shift of its virtual healthcare offerings.
Total visits of 1,239,000 were up 44% year over year on membership gains in U.S. visit fee only and international visits.
For 2019, U.S. paid membership of 36.7 million grew 61.1% year over year.
Total expenses in the quarter were $172.1 million, representing a rise of 22.4% year over year, primarily led by higher marketing and advertising, technology and development, legal and regulatory, and general and administrative expenses.
Adjusted EBITDA was $15.2 million for the quarter, soaring 162.1% year over year.
Financial Update
As of Dec 31, 2019, the company had $517.1 million in cash and short-term investment, up 8.1% from the 2018 end level.
Total debt as of Dec 31, 2019, was $440.4 million, up 6.2% from the level as of Dec 31, 2018.
Yearly Update
For 2019, total revenues were $553.3 million, up 32% year over year. Net loss per share of $1.38 per share was narrower than the prior-year loss of $1.47.
1Q20 Update
For the first quarter of 2020, the company expects total revenues of $169-$172 million and total adjusted EBITDA of $9-$11 million. It projects total visits between 1.4 million and 1.6 million. Net loss per share is expected to be 34-37 cents per share.
2020 Outlook
For 2020, the company expects revenues between $695 million and $710 million, and adjusted EBITDA between $60 million and $70 million. It projects the total U.S. paid membership of 43-45 million, while visit fee only access will likely be available to 19-20 million individuals.
Total visits are expected to be 5.5-5.9 million and net loss per share is expected to be $1.06-$1.19.
Zacks Rank and Stocks to Consider
Teladoc currently carries a Zacks Rank #3 (Hold). You can see the complete list of today’s Zacks #1 Rank (Strong Buy) stocks here.
Among other players from the healthcare industry that have reported fourth-quarter earnings, the bottom line of Stryker Corporation (NYSE:SYK) , HCA Healthcare, Inc. (NYSE:HCA) and IDEXX Laboratories, Inc. (NASDAQ:IDXX) beat the Zacks Consensus Estimate by 1.22%, 0.98% and 14.29%, respectively.
Today's Best Stocks from Zacks
Would you like to see the updated picks from our best market-beating strategies? From 2017 through 2019, while the S&P 500 gained and impressive +53.6%, five of our strategies returned +65.8%, +97.1%, +118.0%, +175.7% and even +186.7%.
This outperformance has not just been a recent phenomenon. From 2000 – 2019, while the S&P averaged +6.0% per year, our top strategies averaged up to +54.7% per year.
See their latest picks free >>
Stryker Corporation (SYK): Free Stock Analysis Report
HCA Healthcare, Inc. (HCA): Free Stock Analysis Report
IDEXX Laboratories, Inc. (IDXX): Free Stock Analysis Report
Teladoc Health, Inc. (TDOC): Free Stock Analysis Report
Original post
Zacks Investment Research