
Buoyed by higher revenues, Synovus Financial Corporation (NYSE:SNV) recorded a positive earnings surprise of 4.0% in third-quarter 2016. This helped the stock gain nearly 1% following the release. Adjusted earnings of 52 cents per share beat the Zacks Consensus Estimate by 2 cents. Also, the reported figure compared favorably with the prior-year quarter tally of 42 cents.
Higher revenues backed by strong loans & deposits balances drove the organic growth. However, escalating expenses remain a concern. Moreover, significant increase in provision for loan losses added to its woes.
Net income available to common shareholders was $62.7 million or 51 cents per share compared with $55.4 million or 42 cents per share in the prior-year quarter.
Organic Growth Reflected; But Expenses Moved Up, Too
Total revenue (excluding gain on investment securities) in the third quarter was $294.1 million, up 7.0% from $275 million in the prior-year quarter. However, the top line marginally lagged the Zacks Consensus Estimate of $296 million.
Net interest income increased 8.8% year over year to $226 million. Moreover, net interest margin expanded 13 basis points (bps) year over year to 3.27%.
Non-interest income was slightly up 1.6% year over year to $68.2 million. The rise was primarily due to increased fiduciary and asset management fees, mortgage-banking revenues, brokerage and insurance income. However, the increase was partially offset by a slight decrease in core banking fees (including service charges on deposit accounts, bankcard fees and other miscellaneous service charges).
On the other hand, total non-interest expenses were $185.9 million, up 4.5% year over year, while adjusted non-interest expenses came in at $183.9 million, up 3.6% from a year ago. Notably, non-interest expenses exhibited a rise in almost all components of expenses and also recorded first-time merger-related expense of $0.55 million.
Total deposits came in at $24.2 billion, up 6.1% year over year. Total net loans climbed 6.4% year over year to $23.3 billion.
Credit Quality: A Mixed Bag
Credit quality metrics for Synovus were a mixed bag in the quarter.
Net charge-offs were $6.9 million, up 2.5% year over year. The annualized net charge-off ratio was 0.12%, stable with the prior-year quarter. Provision for loan losses increased significantly year over year to $5.7 million from $3 million in Sep 2015.
Non-performing loans, excluding loans held for sale, were down 6.0% year over year to $148.2 million. The non-performing loan ratio was 0.64%, down 8 bps year over year.
Additionally, total non-performing assets amounted to $179.1 million, reflecting a decline of 19.3% year over year. The non-performing asset ratio contracted 24 bps year over year to 0.77%.
Capital Position: A Mixed Bag
Tier 1 capital ratio and total risk based capital ratio were 10.07% and 12.05%, respectively, compared with 10.6% and 12.02% as of Sep 30, 2015.
Further, as of Sep 30, 2016, Common Equity Tier 1 Ratio (fully phased-in) was 9.49% compared with 9.98% in the prior-year quarter. Tier 1 Leverage ratio was 8.98% compared with 9.45% in the year-ago quarter.
Effective Sep 29, 2016, Synovus entered into an accelerated share repurchase agreement (ASR) to buy back $50 million worth of common stock. This agreement is part of a $300 million share repurchase program. The ASR is scheduled to be settled on or before Dec 28, following which the repurchase program will be completed.
Our Viewpoint
Results of Synovus reflect a decent performance in the quarter. We believe that the company’s focus on both organic and inorganic growth, together with cost containment efforts will gradually pay off and aid bottom-line expansion in subsequent years. However, a persistent low rate environment and stringent regulations, continue to keep us apprehensive.
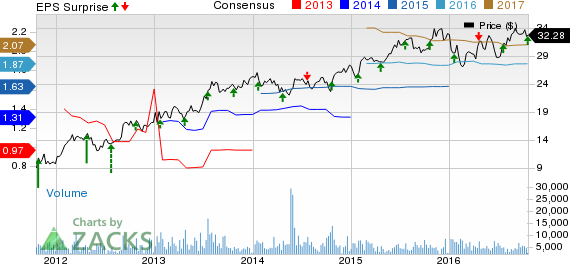
SYNOVUS FINL CP Price, Consensus and EPS Surprise
At present, Synovus carries a Zacks Rank #3 (Hold). You can see the complete list of today’s Zacks #1 Rank (Strong Buy) stocks here.
Among other Southeast banks, First Horizon National Corporation (NYSE:FHN) posted earnings per share of 27 cents for third-quarter 2016, surpassing the Zacks Consensus Estimate of 25 cents. Better-than-expected results were aided by a rise in both net interest income and non-interest income. The company experienced strong growth in loans and deposits. However, rising operating expenses and a significant increase in provisions for loan losses were the downsides.
Regions Financial Corporation (NYSE:RF) recorded third-quarter 2016 earnings from continuing operations of 24 cents per share, which surpassed the Zacks Consensus Estimate of 21 cents. Significantly lower provisions and higher fee revenues drove better-than-expected results. However, these were partially offset by a rise in operating expenses.
Next we have Trustmark Corporation (NASDAQ:TRMK) that is slated to release third-quarter earnings on Oct 25.
Confidential from Zacks
Beyond this Analyst Blog, would you like to see Zacks' best recommendations that are not available to the public? Our Executive VP, Steve Reitmeister, knows when key trades are about to be triggered and which of our experts has the hottest hand. Click to see them now>>
REGIONS FINL CP (RF): Free Stock Analysis Report
SYNOVUS FINL CP (SNV): Free Stock Analysis Report
FIRST HRZN NATL (FHN): Free Stock Analysis Report
TRUSTMARK CP (TRMK): Free Stock Analysis Report
Original post
Zacks Investment Research