
SYNNEX Corporation (NYSE:SNX) delivered non-GAAP earnings of $4.26 per share for fourth-quarter fiscal 2019, which improved 15.4% from the year-ago quarter and also beat the Zacks Consensus Estimate of $3.61.
Moreover, revenues of $6.58 billion surpassed the Zacks Consensus Estimate of $5.999 billion and increased 18.7% year over year as well.
Robust organic growth and the successful integration of the Convergys business are key drivers. Moreover, management noted that forex did not negatively impact the company’s top and the bottom line.
Further, the company announced its intention to split SYNNEX Technology Solutions and Concentrix into two publicly traded companies. Management believes that this strategic action would help add shareholder value and enhance the company's competitive edge. The transaction is expected to be completed in the second half of 2020.
SYNNEX Corporation Price, Consensus and EPS Surprise
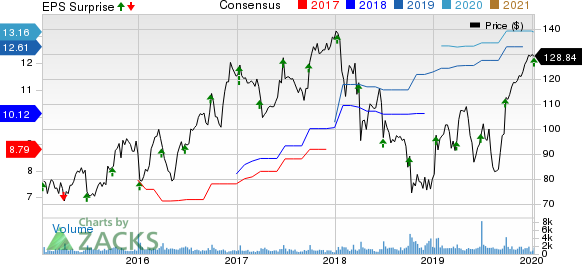
SYNNEX Corporation price-consensus-eps-surprise-chart | SYNNEX Corporation Quote
Quarterly Details
SYNNEX’s Technology Solutions revenues were up 17.4% year over year to $5.4 billion.
Management mentioned that the major project areas contributing to the company’s growth were PCs, networking and cloud plus software related solutions. US remained the key catalyst. Other geographies performed per expectation as well. The company also benefited from the large project and integration business, which was an upside in the sequential quarter too.
Concentrix revenues rose 24.7% from the prior-year quarter to $1.2 billion, driven by the Convergys acquisition. Further, new business wins are a positive. Moreover, the company’s strategy to rebalance its portfolio is encouraging.
In the reported quarter, non-GAAP operating income was up 26.4% to $338.5.5 million. Also, non-GAAP operating margin expanded 31 basis points (bps) on a year-over-year basis to 5.14%.
Non-GAAP operating income for the Technology Solutions was $178 million, up 28% from the year-ago quarter, driven by favorable product mix. Additionally, non-GAAP operating margin surged 30 bps to 3.3%
For the Concentrix segment, non-GAAP operating income was $161 million, rising 25% year over year, buoyed by the Convergys consolidation. Non-GAAP operating margin grew 10 bps to 13.3%.
Balance Sheet and Other Details
SYNNEX ended the fiscal fourth quarter with cash and cash equivalents of nearly $225.53 million compared with $262.3 million as of the previous quarter.
During the quarter, cash flow from operations totaled approximately $349.3 million compared with $250 million sequentially.
Fiscal 2019 Highlights
SYNNEX reported revenues of $23.76 billion in fiscal 2019.
Technology Solutions revenues were $19.1 billion. It generated 80% of revenues in fiscal 2019.
Revenues from the Concentrix segment were $4.7 billion, representing 20% of the total revenue base in fiscal 2019.
Guidance
For first-quarter fiscal 2020, SYNNEX expects revenues in the range of $5.24-$5.54 billion. On a non-GAAP basis, earnings per share are envisioned in the band of $3.03-$3.22.
The company expected the market for Technology Solutions business to remain competitive. Its line card and cross-selling efforts are likely to sustain the sales momentum. The core TS business is projected to grow better than the markets. The company’s project and integration business is expected to be at a more normalized level in the period.
In the fiscal first quarter, the company expects Concentrix business to be within normal seasonal ranges with solid revenue growth and margin expansion.
Management mentioned that in the second half of fiscal 2020, for its largest Hyve customer, there is likely to be a shift in the consignment service model for a large portion of products that the company procures and integrates compared with the current purchase and resell model. This is likely to lower its revenues in the third and fourth quarters by nearly $600 million in each period.
Zacks Rank and Stocks to Consider
Currently, SYNNEX has a Zacks Rank #3 (Hold). A few better-ranked stocks in the broader technology sector are Fortinet, Inc. (NASDAQ:FTNT) , Synopsys, Inc. (NASDAQ:SNPS) and ManTech International Corporation (NASDAQ:MANT) , each flaunting a Zacks Rank #1 (Strong Buy). You can see the complete list of today’s Zacks #1 Rank stocks here.
Long-term earnings growth rate for Fortinet, Synopsys and ManTech is currently pegged at 14%, 12.56% and 8%, respectively.
5 Stocks Set to Double
Each was hand-picked by a Zacks expert as the #1 favorite stock to gain +100% or more in 2020. Each comes from a different sector and has unique qualities and catalysts that could fuel exceptional growth.
Most of the stocks in this report are flying under Wall Street radar, which provides a great opportunity to get in on the ground floor.
Today, See These 5 Potential Home Runs >>
Fortinet, Inc. (FTNT): Free Stock Analysis Report
ManTech International Corporation (MANT): Free Stock Analysis Report
SYNNEX Corporation (SNX): Free Stock Analysis Report
Synopsys, Inc. (SNPS): Free Stock Analysis Report
Original post