Get 40% Off
These stocks are up over 10% post earnings. Did you spot the buying opportunity? Our AI did.Read how

Swiss Stock Market: Is The Bull Run Over?

Published 06/13/2018, 07:43 AM
Updated 07/09/2023, 06:31 AM

It has been over nine years since most stock market indices around the world declared the end of the Great Recession in March 2009. That was when the DJIA and the S&P 500 in the U.S. and the German DAX started recovering from their respective crashes. It was March 2009 when the Swiss stock market fell to 4235 and finally found support, as well.

In January 2018 the Swiss stock market index, which consists of 20 of the largest companies in Switzerland, climbed to a new all-time high of 9616. But instead of catching the flu of optimism, experienced traders and investors tend to worry the most when markets reach new record highs. So let’s take a moment and examine the last nine years through the prism of the Elliott Wave Principle. Hopefully, it will tell us if it still makes sense to join the bulls.
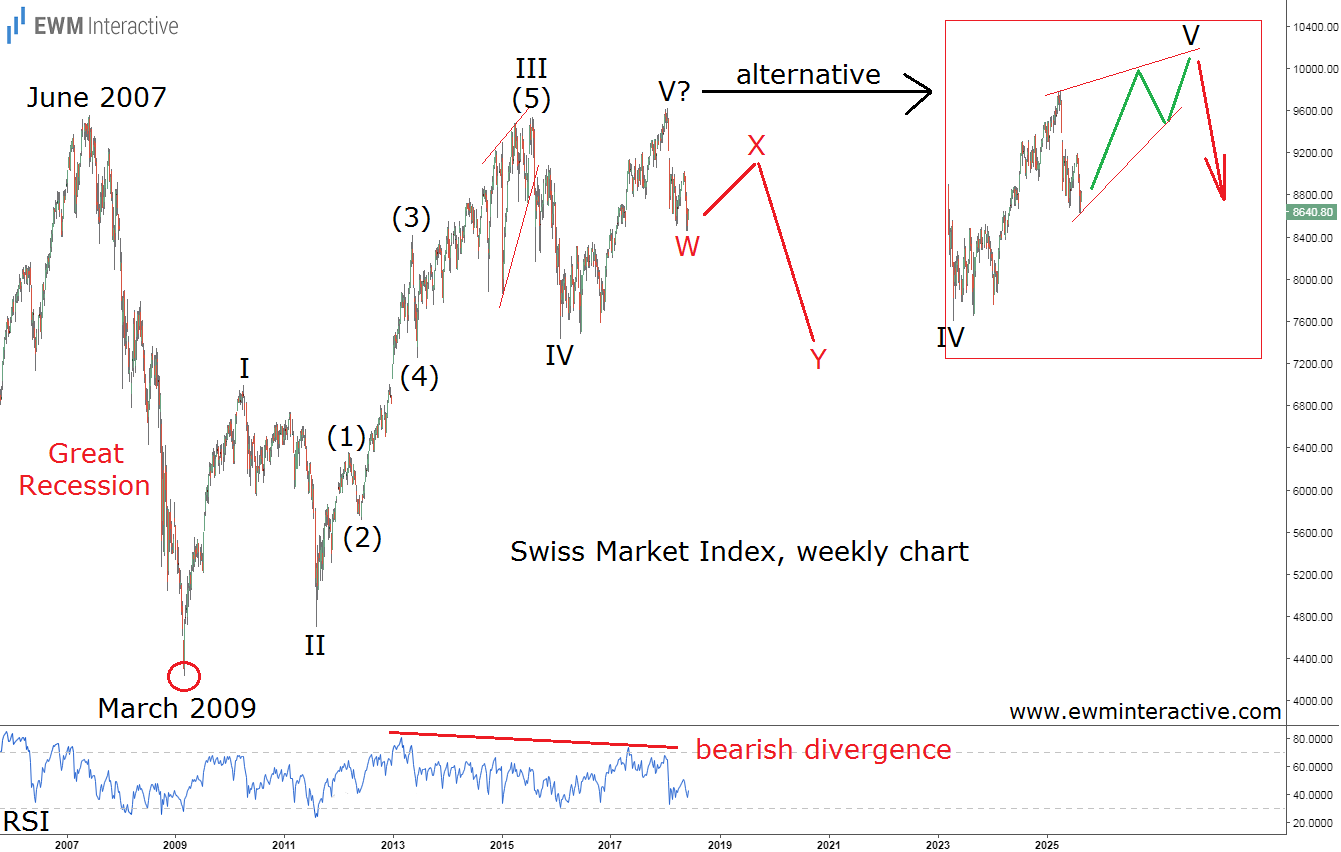
Weekly Swiss Market Index

The weekly chart of the Swiss Market Index (SMI) depicts the 2007-2009 crash as well as the following bull market. What interests us is the wave structure of the surge from 4235 in March 2009. As visible, it could easily be seen as a five-wave impulse with an extended wave III, whose sub-waves are also clearly recognizable.

According to the theory, every impulse is followed by a three-wave correction in the opposite direction. In other words, if this count is correct and wave V is over at 9616, the Swiss stock market index should be expected to fall back to the support area of wave IV near 7500, implying at least 13% downside from current levels. A bearish RSI divergence between waves V and III further reinforces the negative outlook.

3rd party Ad. Not an offer or recommendation by Investing.com. See disclosure here or remove ads .

On the other hand, it might turn out wave V did not end at 9616 and is still in progress as an ending diagonal. If the market chooses this alternative scenario the 10,000 mark is still within the bulls’ reach. In our opinion though, the possibility of gaining 16% in wave V’s last breaths is not worth the risk of losing 13%, especially given the bearish Elliott Wave setup that is already in place on the weekly chart of the Swiss blue chip index.

Original post

Latest comments

Risk Disclosure: Trading in financial instruments and/or cryptocurrencies involves high risks including the risk of losing some, or all, of your investment amount, and may not be suitable for all investors. Prices of cryptocurrencies are extremely volatile and may be affected by external factors such as financial, regulatory or political events. Trading on margin increases the financial risks.
Before deciding to trade in financial instrument or cryptocurrencies you should be fully informed of the risks and costs associated with trading the financial markets, carefully consider your investment objectives, level of experience, and risk appetite, and seek professional advice where needed.
Fusion Media would like to remind you that the data contained in this website is not necessarily real-time nor accurate. The data and prices on the website are not necessarily provided by any market or exchange, but may be provided by market makers, and so prices may not be accurate and may differ from the actual price at any given market, meaning prices are indicative and not appropriate for trading purposes. Fusion Media and any provider of the data contained in this website will not accept liability for any loss or damage as a result of your trading, or your reliance on the information contained within this website.
It is prohibited to use, store, reproduce, display, modify, transmit or distribute the data contained in this website without the explicit prior written permission of Fusion Media and/or the data provider. All intellectual property rights are reserved by the providers and/or the exchange providing the data contained in this website.
Fusion Media may be compensated by the advertisers that appear on the website, based on your interaction with the advertisements or advertisers.
© 2007-2024 - Fusion Media Limited. All Rights Reserved.