Stock Indices Weekly Technical Strategy Outlook (June 15-19)
S&P 500 E-mini Futures: Potential Push Higher, But Multi-Week Correction Likely
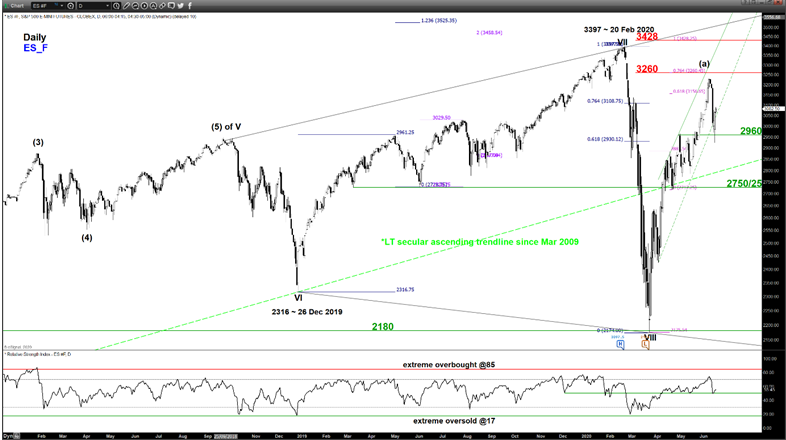
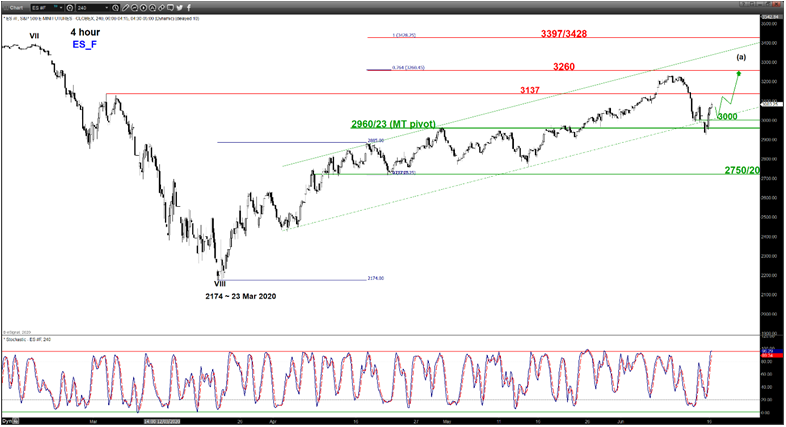
Last week, the S&P 500 E-mini futures has staged the expected minor pull-back of close to -8% from its 08 Jun high of 3231 towards the 2960 predefined key medium-term pivotal support as per highlighted in our previous report.
Interestingly, it has managed to test and held the 2960 level where it printed an intraday low of 2923 on 15 Jun and staged a strong intraday rebound of 4.9% to close above 2960 at the end of the U.S session.
Key Levels
- Immediate support: 3000
- Pivot (key support): 2960/23
- Resistances: 3260 & 3397/3428
- Next support: 2750/20
Directional Bias
Maintain bullish bias in any pull-back for the S&P 500 E-mini futures with 2960/23 as the key medium-term pivotal support for a further potential impulsive upleg to target the next significant resistances at 3260 and 3397/3423 (fresh ATH). Thereafter, the S&P 500 E-mini futures faces the risk of a multi-week corrective decline to retrace the entire 3-month uptrend in place since 23 Mar 2020 low.
However, a daily close below 2960 invalidates the bullish scenario to trigger the multi-week corrective decline towards the next support at 2625.
Key Elements
- The Index is still evolving within a medium-term ascending channel in place since 02 Apr 2020 low of 2424 with the lower boundary of the channel coming to act as a support at 3000. The upper boundary/resistance of the channels confluences with 3397/3423 which is defined by a Fibonacci extension cluster.
- The daily RSI oscillator remains bullish above a corresponding support at the 50 level which suggests medium-term upside momentum remains intact.
- The current rebound seen from 15 Jun low of 2923 is likely the wave 9 of (a) of an intermediate-term bullish impulsive sequence in place since 23 Mar low of 2174 according to the Elliot Wave Principle/fractal analysis. A 9-wave impulsive sequence to the upside represents an extended uptrend, hence the risk has started to increase for an impending multi-week corrective decline after the completion of wave 9 of (a).
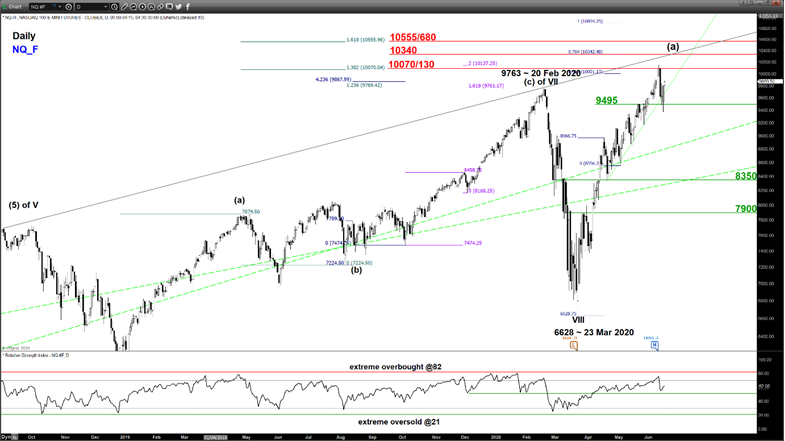
Nasdaq 100 E-mini Futures: Eyeing Another Fresh All-Time High Before Potential Multi-Week Correction
Key Levels
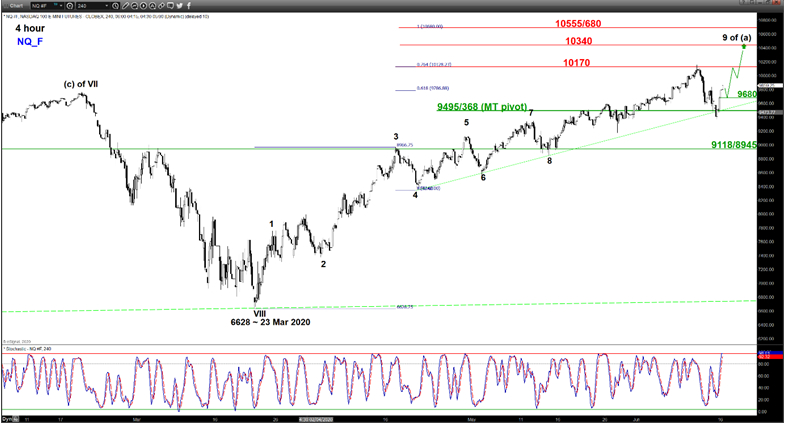
- Immediate support: 9680
- Pivot (key support): 9495/368
- Resistances: 10155/170& 10340
- Next support: 9118/8945
Directional Bias
Maintain bullish bias in any pull-back for Nasdaq 100 E-mini futures with 2960/23 as the key medium-term pivotal support for a further potential impulsive upleg to rests the recent 10155/170 (recent 10 Jun high) before targeting the next significant resistance at 10340 (fresh ATH).
Thereafter, the Nasdaq 100 E-mini futures faces the risk of a multi-week corrective decline to retrace the entire 3-month uptrend in place since 23 Mar 2020 low.
However, a daily close below 9368 invalidates the bullish scenario to trigger the multi-week corrective decline towards the next support at 9118/8945.
Key Elements
- The Index has continued to be supported by an ascending support in place since 21 Apr 2020 low of 8342.
- The daily RSI oscillator remains bullish above a corresponding support at the 51 level which suggests medium-term upside momentum remains intact.
- The 10340 medium-term significant resistance is defined by a key Fibonacci extension level and the upper boundary of a major “Expanding Wedge” in place since Aug 2018.
Nikkei 225 Futures: Pull-Back Target (NYSE:TGT) Met, Enroute To Major Range Top Of 24130/515
Key Levels
- Pivot (key support): 21500
- Resistances: 23310 &24130/515
- Next support: 20020
Directional Bias
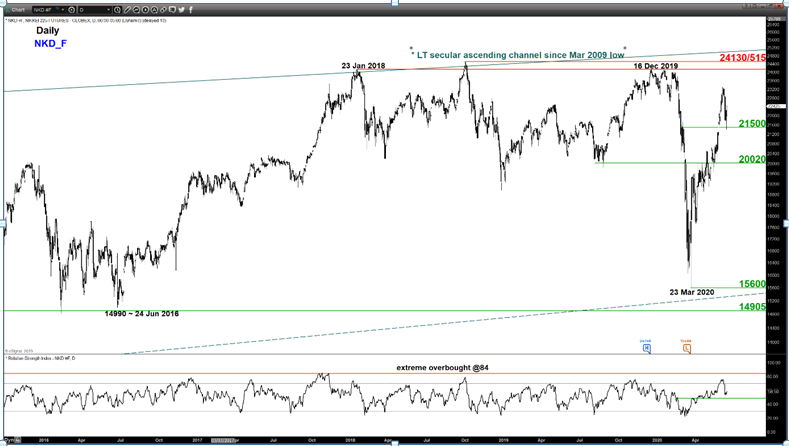
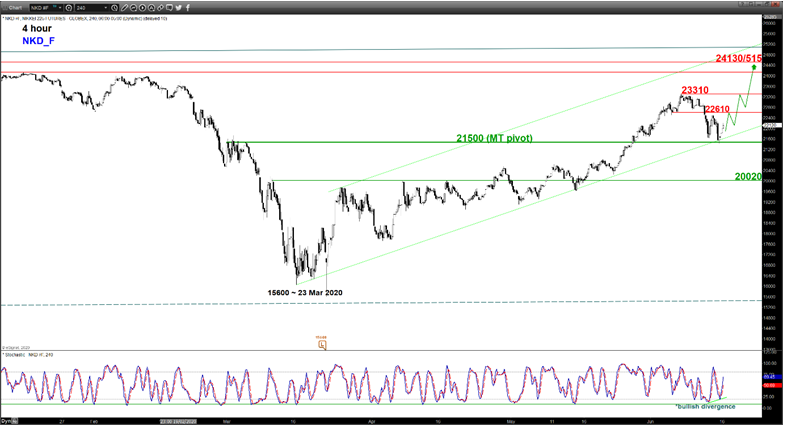
The pull-back seen on Nikkei 225 Futures has managed to stall right at the predefined 21500 key medium-term pivotal support(printed a low of 21405 on 15 Jun before it staged a bounce to close above 21500 on a daily basis). Maintain bullish bias for a further potential upleg to retest the recent 23310 high of 05 Jun before targeting the 24130/515 major range top/resistance in place since Jan 2018.
However, a daily close below 21500 invalidates the bullish scenario to trigger the multi-week corrective decline towards the next support at 20020.
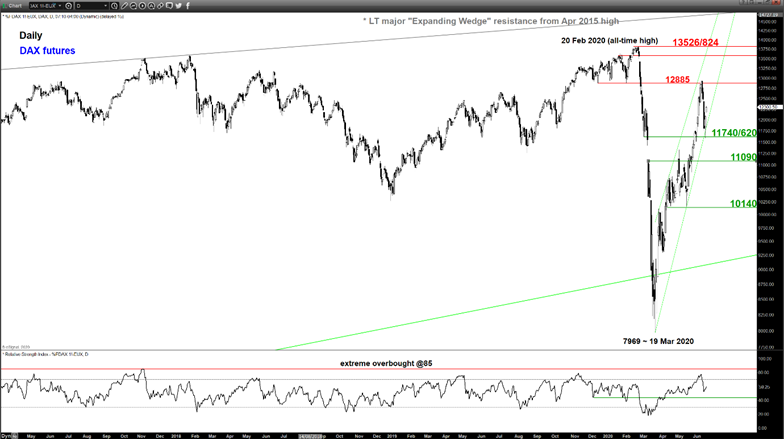
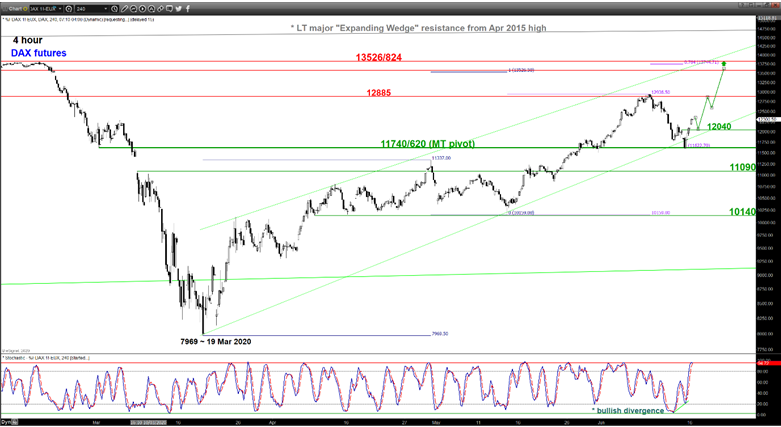
DAX Futures: Pull-Back Stalled At 11740/620 Key Support
Key Levels
- Immediate support: 12040
- Pivot (key support): 11740/620
- Resistances: 12885 & 13526/824
- Next supports: 11090 & 10140
Directional Bias
The DAX Futures pull-back that has taken form since last week has managed to stall at the 11740/620 predefined key medium-term pivotal support (printed an intraday low of 11589 on 15 Jun & staged a bounce of 4.2% to record a daily close above 11620). Maintain bullish bias in any dips above 11740/11620 for a further potential upleg to retest the recent 09 Jun high of 12885/12936 before targeting the next resistance zone of 13526 (current ATH)/13824.
However, a daily close below 11620 invalidates the bullish scenario to trigger a multi-week corrective decline towards the next supports at 11090 and 10140 next.

