
Yesterday I gave you all the reasons why a pullback in the S&P 500 was likely, and today I'll talk about the reasons why remaining bullish is still the most sensible thing to do if you love your trading account.
In short, little has changed in terms of the outlook. The S&P 500 closed back at the line connecting the early June highs—but quite a few bullish signs emerged yesterday, solidly tipping the odds of upcoming upswing in the bulls' favor.
S&P 500 in the Short-Run
I’ll start with the daily chart perspective (charts courtesy of http://stockcharts.com ):
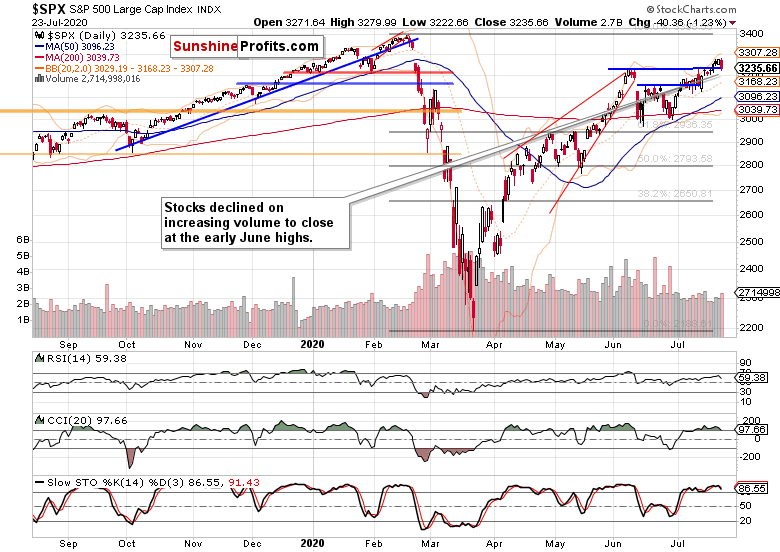
The daily setback is clearly visible, but was it a game changer? I don't think so—even with new unemployment claims coming in above expectations, and existing ones unsurprisingly stubbornly high, the focus isn't on the harsh economic realities of many real economy sectors, but on the upcoming measures to counter them.
It’s all eyes on the stimulus – and that's why the elevated volume is rather a sign of momentary setback and not a full-blown reversal. The late-Feb bearish gap is being put to test, and I expect the bulls to overcome it eventually. Earlier in July, we have also experienced an odd bearish day that brought out the bears from their caves, without really changing the situation on the ground materially.
I expect the same dynamics to play out this time as well, regardless of the headlines touting more stimulus details only next week, or Trump discussing the value of the China phase one trade deal.
Let's check the credit market clues next, because that's where one of the bullish signs just emerged.
The Credit Markets’ Point of View

High yield corporate bonds (HYG ETF) ran into headwinds yesterday, and just couldn't extend last days' gains. The bears pushed hard for a reversal, but were repelled well before the closing bell. The result is a hanging man candlestick—while bearish on its own, it's unlikely that it marks more than a fleeting reversal of fortunes.
Remember that the Fed is stepping up to the plate again. Treasuries of whatever duration are salivating at the prospect of more money being thrown at the issues. As we're at the "everyone benefits, no one pays" stage of inflation, there ain't no breaking the stock bull's neck yet.
Both the leading credit market ratios—high yield corporate bonds to short-term Treasuries (HYG:SHY) and investment grade corporate bonds to longer-dated Treasuries (LQD:IEI)—highlight a daily pause (you can find this and other charts at my home site), relatively speaking.
The overlaid S&P 500 closing prices (black line) against the HYG:SHY chart shows just how far have stocks retreated yesterday. That's a telling perspective putting into context my yesterday's conclusion of better to be waiting for short-term mispricing opportunities. One is still staring us in the face currently.
Smallcaps, Emerging Markets and the S&P 500 Internals
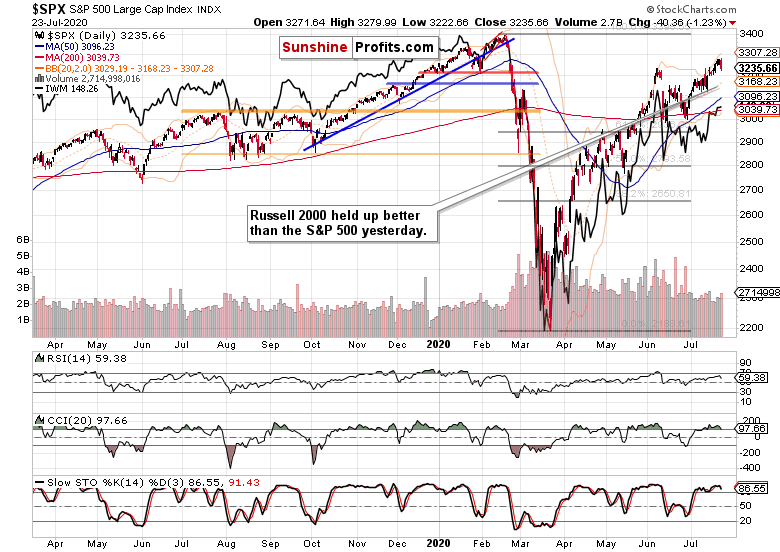
The Russell 2000 (IWM ETF) brings out the second bullish sign—the smallcaps held up much better than the 500-strong index. In place of their rather usual underperformance, that's a bullish sign. Also IWM ETF volume yesterday points to a run-of-the-mill session, and not an emotionally charged battle.
That leaves only the emerging markets (EEM ETF) declining in unison with the S&P 500 yesterday. Should US-China tensions get ratcheted up a notch or two, that would work to lift the US dollar and send the stock bulls temporarily packing. Remember though, that a fallout in relations isn't in the interests of either party, and the weak reaction in both the greenback and stocks reveals the market treating it as a flash in the pan.
Even the daily market breadth didn't dip profoundly into the bearish territory as the advance-decline line shows chiefly. The bullish percent index is still solidly bullish, and that means dips better be bought.
The fact that market breadth didn't take a hit yesterday, shows that the plunge was driven by tech (XLK ETF) with the other sectors more or less refusing to participate broadly. Even semiconductors (XSD ETF) didn't decline as profoundly as technology did. All of these are in-your-face signs that the stock bull has much farther to run, and all we're seeing, is a healthy consolidation coupled with sectoral rotation.
Summary
Summing up, yesterday's S&P 500 setback hasn't materially changed the optimistic stock outlook, and the bullish signals arising out of Thursday's session support this conclusion. With credit markets not yielding and technology consolidating its meteoric gains, it's time for the beaten-down areas to start catching up, and lift the index. Unless the unexpected happens and stimulus doesn't appear on time to support the real economy and the markets (it will appear), the stock bull run is immune to the temporary shocks of U.S. – China retaliations caliber. With lockdowns thankfully failing to gain much traction not just on the federal level, the risks in stocks remain skewed to the upside.