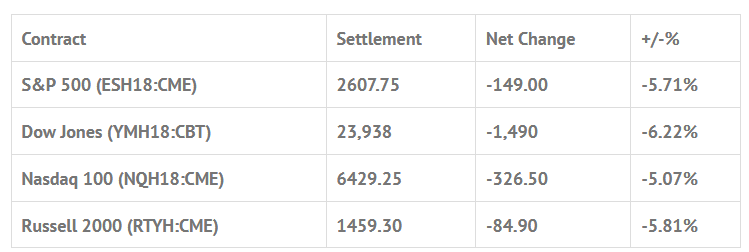
Index Futures Net Changes and Settlements:

Foreign Markets, Fair Value and Volume:
- In Asia 11 out of 11 markets closed lower: Shanghai Comp -3.38%, Hang Seng -5.12%, Nikkei -4.73%
- In Europe 12 out of 12 markets are trading higher: CAC -2.31%, DAX -2.01%, FTSE -2.02%
- Fair Value: S&P -0.41, NASDAQ +5.52, Dow -38.07
- Total Volume: 3.9mil ESH & 1.3k SPH traded in the pit
Today’s Economic Calendar:
International Trade 8:30 AM ET, James Bullard Speaks 8:50 AM ET, Redbook 8:55 AM ET, JOLTS 10:00 AM ET, and Treasury STRIPS 3:00 PM ET.
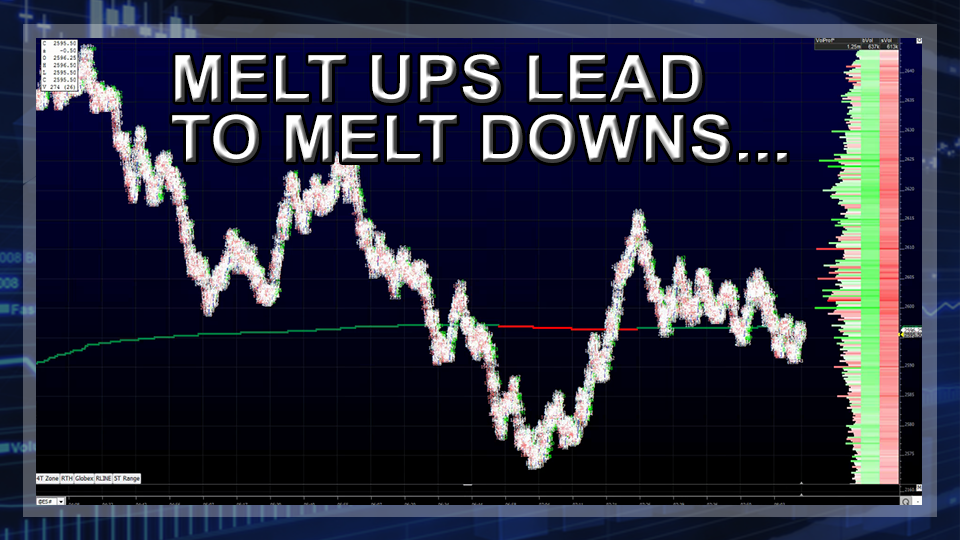
S&P 500 Futures: ‘Flash Crash 2.0’ Takes The #ES Down To 2542, Down 12% From The All-Time 2878.50 High

The S&P 500 futures opened yesterday’s session on the heels of the worst performing week in two years. Some traders were seeing value with Friday’s move down to the 2750 area, while others were looking for follow through. After an overnight session covering a 24 handle range, the 8:30 am cst cash open printed 2746.25, down 10.50 handles. After pushing down to an early low of 2734.50 in the first ten minutes, the futures firmed up and started higher before a strong 9:00 am cst buy program helped propel the ESH18 up 28.50 handles in just over a half hour, to a high of 2764.
From there, with the S&P’s then up 7.25 handles, it looked like it was going to pull back before launching higher, but buying stalled out at those levels, and it was still early in the day. Once the buy imbalances dried up, sellers began hitting the bids, and longs found themselves in trouble.
The first push was down to 2732.50 just before 11:30, making a new low on the day. It looked like bulls may try to take over, but the rally was limited to 2743.25, 10.75 handles, before sellers resumed pressing buttons down to 2715, down 41.75 handles, just before 12:30 cst. Once again it looked like bulls would push high but failed at 2731.25 just before 1:00 pm cst.
From there matters turned very messy very quickly. The ES began to pick up steam, and the momentum punished buyers, pushing the index down to 2635.50, down 110.25 handles, just after 2:00 pm. There was a move of 55 handles in about seven minutes. This lead to a 61.50 handle bounce in just under 20 minutes, up to 2697, before sellers took advantage of a $3.3 billion MOC imbalance that was building, pulling the benchmark index down to 2601.75, before settling at 2607.50, down 148.25 handles. On the re-open a new low was made at 2595.75, where some support was found, and just a few prints from the 2590 10% correction area.
VIX Up 117%, Largest One-Day Percentage Gain Ever
While equities were moving, risk off assets such as gold moved at a modest pace, and crude oil, which was down $2.00, or -3% down to $63.44, was down moderately. The 10 YR T-Note was up 1% as yield dropped to 2.79% as money that has moved out of equities over the last week seemed to be finding hope in safe T-Notes. The $VIX closed up an astounding 117% at 37.32 after trading as high as 38.80 on the session, its largest one-day percentage gain ever, and the S&P 500 cash index closed down -4.10%, a percentage point better than the futures, which suggest that there was a lot of hedging going on in the futures markets.
Disclaimer: Trading Futures, Options on Futures, and retail off-exchange foreign currency transactions involves substantial risk of loss and is not suitable for all investors. You should carefully consider whether trading is suitable for you in light of your circumstances, knowledge, and financial resources. Any decision to purchase or sell as a result of the opinions expressed in the forum will be the full responsibility of the person(s) authorizing such transaction(s). BE ADVISED TO ALWAYS USE PROTECTIVE STOP LOSSES AND ALLOW FOR SLIPPAGE TO MANAGE YOUR TRADE(S) AS AN INVESTOR COULD LOSE ALL OR MORE THAN THEIR INITIAL INVESTMENT. PAST PERFORMANCE IS NOT INDICATIVE OF FUTURE RESULTS.
