STOCKS:
The European debt contagion remains front and center, with China “hard landing” concerns creeping into the conversation. Also, US economic data is starting to soften...surprising many. Collectively, given the the economic deceleration — it seems traders are looking for QEn+1, which has held up prices longer than is reasonable. Beware.
STRATEGY: The S&P 500 remains above long-term support at the 160- wma at 1179; which delineates bull/bear markets. But price action has turned atrocious, which suggests tenatively that a bear market has begun. However, we’ll watch the transports: a breakout higher would be bullish of equities in general.
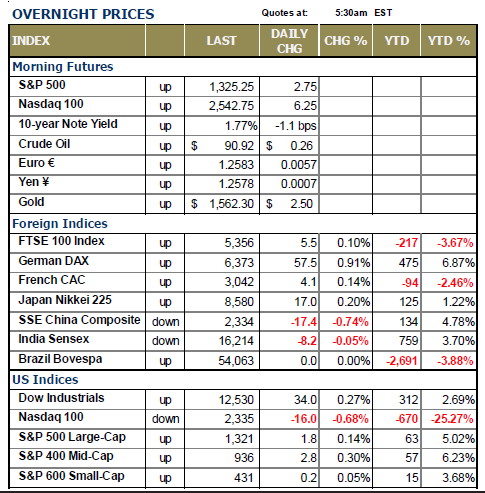
EUROPEAN BOURSES ARE HIGHER LED BY GERMANY GOING INTO THE LONG US MEMORIAL DAY HOLIDAY, but while there are still gains – they have come off their highs to be sure. German remains higher by +0.7% to lead Europe; China leads Asia to the downside by -0.7%. The “risk-on” trade is on in modest fashion; the US dollar is higher; precious metal prices are higher – and energy prices are higher. All European 10-yr note yields are lower by the barest of margins…a circumstance we haven’t seen in quite some time. Spain’s 10-yr is approaching the psychologically critical 6.00% level from above as it is trading 6.12%...it was recently 6.35%. A break below 6.00% would get the world a “warm and fuzzy feeling”; something to watch carefully as it would spark a rally in all risk assets.
One has to wonder what could materialize in the current toxic environment; and we can only believe that traders would begin to discount the prospect of the Greek election going to the previous ruling parties rather than “upstart” left-leaning Spriza. Perhaps the Greek people are coming to grips that to stay in the Eurozone – which they seemingly want to do given recent polls show 85% supporting the notion. However, the only issue is the “cost” to them for doing so, which is adhering to the current agreements.
TRADING STRATEGY: Nothing has changed. For all intents and purposes, we are “flat” and watching. We can make the case the S&P shall rally towards upwards of 1350 in the days ahead, and then falter into that zone, which will precipitate a decline back into the 200-dma/380-dema cross at 1275. In
other words, prices will remain volatile and choppy – either putting in a top or a bottom. We look to stand nimble by putting on a starter short position in TWM as 1350 is approached – we’re likely to consider covering it at as 1275 is tested.
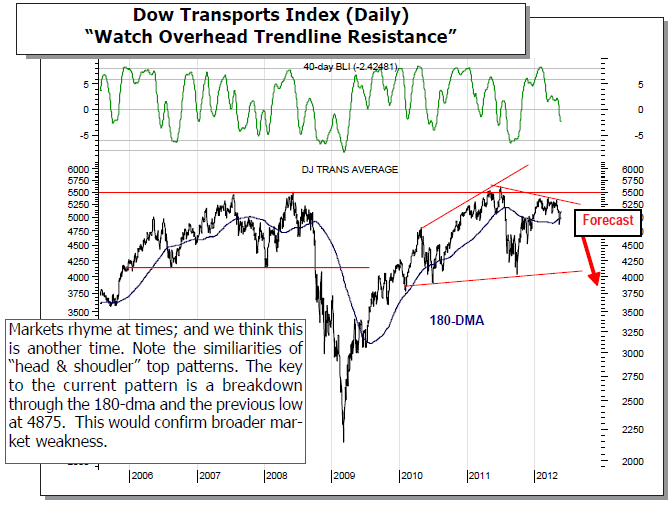
We should also point out our interest in the lead chart position today on page 1 is the Dow Transports (DJT). Quite simply, the transports have quietly begun to rally after testing and ultimately holding above its 180-day moving average…which is itself rising. This remains a bullish island in a bearish sea, and we must understand that if the transports gain further strength through overhead down sloping trendline resistance – then the probabilities are high that a larger and broader rally is underway. But having said this, if its foray above its 60-wma at 5050 falters – then we’ll feel better about calling a top in the transports. We aren’t taking the transports lightly at this point as they may very well be the “canary in the coal” mine for the bullish crowd.
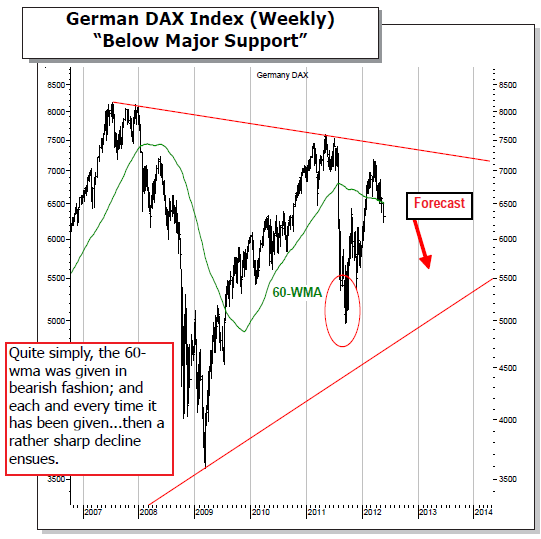
This would go against our “leanings” at this point, for we are focusing upon specific material technical breakdowns in the country indices such as Germany’s DAX, Brazil’s Bovespa and Hong Hong’s Hang Seng – each of which is
below weekly and monthly moving average support levels that have led to bear markets in the past.
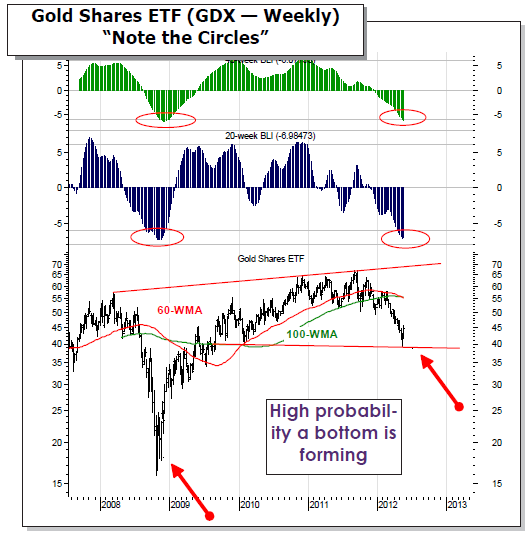
A BOTTOMING GROUP: Over the past several months, we tried in to time a bottom in various gold shares…to no avail. We’ve known we were close, but were always forced out as prices were in a “capitulation phase we believe. Now, it would appear that the Gold Shares ETF is starting to put in an intermediate-term bottom, which means corrections should be bought. We’ve included a weekly GDX chart that clearly shows “a bottom”, but the probabilities of it being “the bottom” are growing given both the intermediate and
long term models are both at oversold levels. Typically, this is a “high confidence” pattern that has held to sustained rise in gold shares. And given they are washed out and unloved – perhaps now is the perfect place to start to accumulate GDX. We’ve decided to use the basket of gold shares to try and mitigate any particular country or company problems – staying with the diversified group seems rather “smart” at this time. However, if there were one stock in the group we would be akin to buying out right – it would be Newmont Mining (NEM) given its stable 3.00% dividend.
To Read the Entire Report Please Click on the pdf File Below.
