
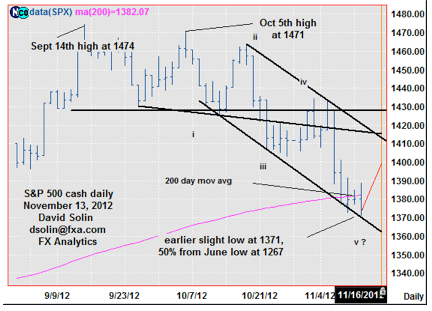
The market is chopping near its recent lows, earlier bouncing from a slight new low and test of the longer term 1368/71 support area (50% retracement from the June low at 1267). With the market oversold after the last few months of sharp declines and seen within the final downleg in the fall from Oct (wave v), potential is rising for at least a few weeks of gains (and possibly more, see longer term below), and this is a "logical" place to form such a low (see daily chart below). Also, some in the market are talking about this afternoon's solar eclipse which will at times coincide with market turns, and adds to this view of a potential bottom in stocks (if you are a believer). Finally Apple Computer is quickly nearing the previously discussed, longer term $520/30 support area and also a "logical" area to form a bottom in that stock (would add to the view of a bottom in the broader S&P 500 given its large market capitalization, and stature as a market "bellwether"). Nearby resistance is seen at 1393/96 and the ceiling of the multi-month bearish channel (currently at 1417/20).
Strategy/Position
With the market seen potentially bottoming (and if more aggressive), want to be long and would buy here (currently at 1375). Initially stop on a close below 1364 given the risk for more basing nearby, but switching to a stop on a close below the bullish trendline drawn from the June, low once at least a temporary bottom is seen in place (this support area holds for at least a few days, into Thurs for example). Also note that at times markets will just accelerate through these perceived, key levels and break below this 1364 area would argue a more substantial downside directly ahead. Was unfortunately stopped on the Oct 23 sell at 1413 on the Nov. 1 close five pts above the falling support line/broken base of the bear channel since Sept (closed at 1427, 7 pts above), and before resuming the decline soon after.
Long-Term Outlook
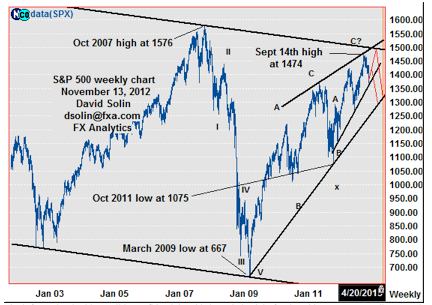
Very long term, very bearish outlook remains as the fall from the Oct 2007 high at 1576 occurred in 5 waves, suggests the very long term downside is not "complete", and with eventual declines all the way back to the March 2009 low at 667 and even below. But as been warning for quite sometime, within this long term scenario the market can retrace as high as the 1576 high (100%), as the global flood of liquidity has, and may continue to, prolong the long term topping process. But have also been discussing the decreasing effect of each round of quantitative easing, which has indeed been occurring, and suggests that the more major top may indeed be finally nearing.
At this point, there appears to be two potential scenarios:
- a more major top is in place at the Sept high at 1474. This would suggest that the potential few weeks of upside (see shorter term above) would likely be a period of ranging with limited, big picture upside (within wave 4 in the fall from the Sept high), and before resuming the decline. This in turn would confirm a top for at least another 3-6 months (and likely more) was in place as 5 waves down from the Sept high at 1474 would be seen (larger downside not "complete", and in turn increase the likelihood that the more major top is also in place).
- the market snaps back from near here, pushing all the way back to the Sept high at 1474 and even just above, as part of a longer term topping (see both in red on weekly chart/2nd chart below). Suspect that the action in regards to the upcoming fiscal cliff may be the driver to determine which shape/pattern that this long term topping takes. Key longer term resistance above the Sep high at 1474 is seen at the ceiling of the 10-year bearish channel (currently at 1500/10), while key support is seen at the bullish trendline from Sept 2011 (cur at 1255/65), and the bullish trendline from the March 2009 low (currently at 1235/45).
Though there is still no confirmation of a more major high, the potential has increased and even in the case of more, big picture topping, any further upside would likely be limited. So for now, would maintain the longer term bearish bias that was put in place way back on Apr 24 at 1369.
- Current: Nearer term : long Nov 13th at 1375, scope for another few days of bottoming.
- Last: short Oct 23rd at 1413, stopped Nov 1st at 1427.
- Longer term: bearish bias on Apr 24 at 1369, may see a few months (or more) of broad topping.
- Last: bearish bias on Aug 19th at 1140 to neutral on Jan 4th at 1275.
David Solin Partner, Foreign Exchange Analytics