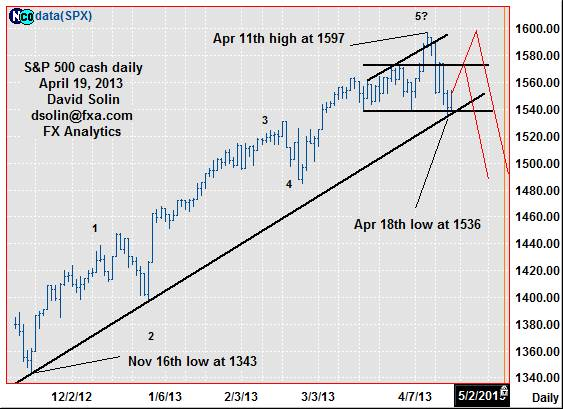
The market has found support at the April 18th low at 1536 (both the bullish trendline from Nov and the area that has provided support since March), and after the tumble from the April 11 high at 1597. With the market overbought after the surge since November and within the long discussed, long term resistance area at 1595/20, the market is seen in process of forming a more major top. Nearer term however, an even more extended period of topping (at least another few weeks) is favored. Note that important time cycles peak in mid/late June, while more "complex" tops tend to form after sharp upmove. Add to this a nearer term view of a more extended topping. At this point, the shape/pattern of this topping process is a question (may be forming a large head and shoulders or could see more topping back toward the 1597 high, see in red in daily chart below), but in both cases at least some near term upside is favored. Nearby resistance is seen at 1557/60 and 1573/76 - "ideal" are for the right shoulder of a head and shoulders to form.
Strategy/position:
Short from April 3 at 1554 but with some risk for more extended period of topping ahead, would the small profit here (currently at 1550). Looks like a good risk/reward to switch to the bullish side if more aggressive, stopping on a close below that bullish trendline from November currently at 1535/38, limited risk. Will get more aggressive with stops on nearby gains to maintain a good overall risk/reward in the position, given that such upside action would be seen part of a larger topping.
Long term outlook:
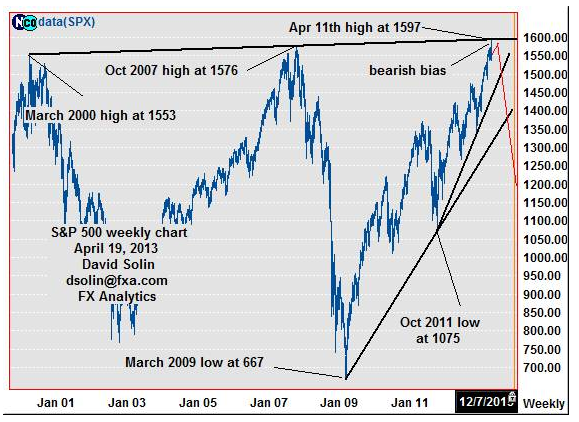
As previously discussed, key longer term resistance in seen at the rising trendline from March 2000 (currently at 1595/20, Apr 11th high) and is an "ideal" area to form a more major top for at least a year or more, (see in red on weekly chart/2nd chart below). Note that the market is extremely overbought after the last 3 years of sharp gains, and in turn suggests that the nearer term topping discussed above, may indeed be a more substantial top (larger reversals generally begin with smaller ones). Longer term support is seen at the bullish trendline from October 2011, currently at 1440/45.
Long term strategy/position:
Switched the longer term bias to the bearish side on April 3 at 1554. Though there is still no confirmation of a more major top "pattern-wise", at least a nearer term top is seen forming with the potential to be more substantial. So for now, will stay with that negative bias.
- Nearer term: long April 19 at 1550, stopping on a close below the bull t-line from Nov (cur 1535/38).
- Last: short Apr 3 at 1554, took small profit April 19 at 1550 (4 pts).
- Longer term: bearish bias April 3 at 1554, scope for a few weeks/month of a broader topping.


