
Qualcomm Incorporated (NASDAQ:QCOM) reported healthy fourth-quarter fiscal 2019 financial results, wherein the top line and the bottom line beat the Zacks Consensus Estimate. However, both metrics declined year over year on macroeconomic challenges.
Net Income
On a GAAP basis, net income for the September quarter was $506 million or 42 cents per share against net loss of $513 million or loss of 36 cents per share in the prior-year quarter.
Quarterly non-GAAP net income came in at $947 million or 78 cents per share compared with $1,260 million or 89 cents per share in the year-ago quarter. The figure exceeded the top end of management’s guidance due to higher Qualcomm Technology Licensing (QTL) revenues. The bottom line beat the Zacks Consensus Estimate by 7 cents.
QUALCOMM Incorporated Price, Consensus and EPS Surprise
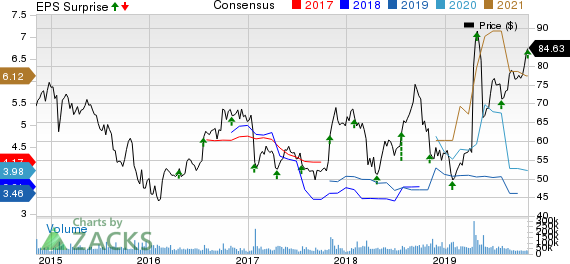
QUALCOMM Incorporated price-consensus-eps-surprise-chart | QUALCOMM Incorporated Quote
For fiscal 2019, GAAP earnings were $4,386 or $3.59 per share, while non-GAAP earnings came in at $4,323 million or $3.54 per share. In fiscal 2018, Qualcomm reported GAAP loss of $4,964 million or loss of $3.39 per share, while non-GAAP earnings were $5,343 million or $3.62 per share.
Revenues
On a GAAP basis, total revenues for the fiscal fourth quarter were $4,814 million compared with $5,778 million in the prior-year quarter. The figure surpassed the consensus estimate of $4,718 million and was above the midpoint of the earlier guided range due to solid QTL revenues on higher unit sale and strong product mix.
For fiscal 2019, GAAP revenues were $24,273 million compared with $22,611 million in fiscal 2018.
Segment Results
Quarterly revenues from Qualcomm CDMA Technologies (QCT) declined 22% year over year to $3,611 million, due to weakening demand for 4G solutions. Mobile Station Modem (MSM) chip shipments were 152 million, down from 232 million. EBT margin decreased to 14% from 17% in the prior-year quarter.
QTL revenues were $1,158 million, down 4% year over year. The figure came in slightly above the midpoint of management’s guided range driven by higher unit sale and strong product mix. EBT margin was 68% compared with 64% in the year-ago quarter, and exceeded the high end of the company’s guidance on lower operating expenses due to faster-than-anticipated reduction in excess litigation expenses.
Cash Flow & Liquidity
For fiscal 2019, Qualcomm generated $7,286 million of net cash from operating activities compared with $3,908 million in the year-ago quarter. At fiscal end, the company had $11,839 million in cash and equivalents with $13,437 million of long-term debt compared with respective tallies of $11,777 million and $15,365 million a year ago.
During the reported quarter, Qualcomm paid out cash dividends totaling $711 million or 62 cents per share. At quarter-end, the company had $7.1 billion available for repurchase under its $30 billion stock buyback program.
Guidance
For the first quarter of fiscal 2020, Qualcomm currently expects revenues of $4.4-$5.2 billion. Non-GAAP earnings are projected in the 80-90 cents per share range. Revenues at QTL are expected between $1.3 billion and $1.5 billion. For QCT, the company anticipates MSM shipments in the range of 145 million to 165 million units.
For calendar 2019, Qualcomm reiterated its earlier guidance of 1.7 billion to 1.8 billion units for global 3G, 4G, 5G devices. For calendar 2020, the company estimates sales of 1.75 billion to 1.85 billion units, up approximately 3% at the midpoint, reflecting flat handsets and low double-digit growth in non-handsets. Qualcomm expects 175 million to 225 million 5G handset units for calendar 2020.
The company anticipates to witness an inflection point for QCT in the fiscal first quarter as it realizes the benefits from the ramp of 5G handset launches. For the fiscal second quarter, management anticipates QCT revenues to grow in the mid-teens on a sequential basis with EBT margins in the mid-teens.
Zacks Rank & Stocks to Consider
Qualcomm currently has a Zacks Rank #3 (Hold). Better-ranked stocks in the industry include United States Cellular Corporation (NYSE:USM) , ATN International, Inc. (NASDAQ:ATNI) and Verizon Communications Inc. (NYSE:VZ) , each carrying a Zacks Rank #2 (Buy). You can see the complete list of today’s Zacks Rank #1 (Strong Buy) stocks here.
United States Cellular Corporation delivered an average positive earnings surprise of 13.4% in the trailing four quarters, beating estimates twice.
ATN International delivered an average positive earnings surprise of 143.9% in the trailing four quarters.
Verizon has long-term earnings growth expectation of 4.2%. It delivered an average positive earnings surprise of 2.2% in the trailing four quarters, beating estimates on each occasion.
Wall Street’s Next Amazon (NASDAQ:AMZN)
Zacks EVP Kevin Matras believes this familiar stock has only just begun its climb to become one of the greatest investments of all time. It’s a once-in-a-generation opportunity to invest in pure genius.
Click for details >>
QUALCOMM Incorporated (QCOM): Free Stock Analysis Report
Verizon Communications Inc. (VZ): Free Stock Analysis Report
ATN International, Inc. (ATNI): Free Stock Analysis Report
United States Cellular Corporation (USM): Free Stock Analysis Report
Original post
Zacks Investment Research