
Q2 earnings reports continue to come in ever so slightly better, with the growth pace modestly improving from the prior-quarter’s level and estimates for the current period coming down less than has been the trend in other recent reporting cycles. With more than 60% of the reports already out, this trend will likely hold through the end of this earnings season. This modest improvement notwithstanding, growth is still hard to come by, with Q2 is on track to be the 5th quarter in a row of earnings declines for the S&P 500 index.
At this stage, the overall trends are pretty much set for all the sectors, except Utilities and Retail. After this week’s busy reporting docket - just over 1000 companies coming out with Q2 results, including 116 S&P 500 members that will have any meaningful number of reports still awaited. Overall, we will have seen Q2 results from almost 87% of the index’s membership by the end of this week.
The Q2 Earnings Scorecard (as of July 29th)
We now have Q2 results from 317 S&P 500 members that combined account for 73.5% of the index’s total market capitalization. Total earnings for these 317 companies are down -3.3% from the same period last year on -0.9% lower revenues, with 72.9% beating EPS estimates and 53.6% coming ahead of top-line expectations.
The table below provides the current scorecard
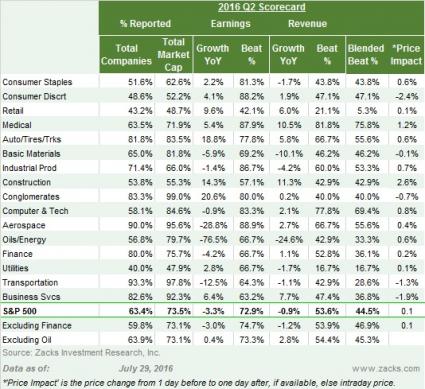
The first column of the above table shows what percentage of each sector’s total members have reported results; the second column shows what percentage of that sector’s total market cap has reported results. As you can see, the 317 index members or 63.4% of the index’s total membership, account for 73.5% of its total market cap. The Retail and Utilities sectors are the only ones at this stage that still have more than half their reports still to come.
The side-by-side charts below compare the results thus far from the 317 index members with what we have seen from the same group of index members in other recent periods. The left-hand chart compares the earnings and revenue growth rates with historical periods while the right-hand chart is doing the same comparisons for positive EPS and revenue surprises.
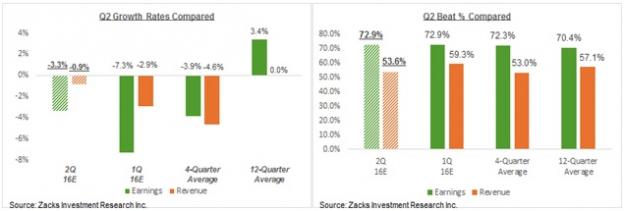
Here are the takeaways from these comparison charts are:
First, the earnings growth (green bars in the left-side chart above) remains negative, but it is an improvement over what we saw in the preceding quarter and the average growth pace for these 317 index in the preceding four quarters.
Second, revenue growth (orange bars in the left-side chart) is not only positive, but also tracking above what we saw from this group of 317 S&P 500 members in 2016 Q1 and the 4- and 12-quarter averages. The positive revenue growth at this stage is a notable improvement in the earnings picture.
Third, positive EPS surprises (green bars in the right-side chart) for this group of companies are about in-line with historical periods, suggesting that estimates may not have been that low after all.
Fourth, positive revenue surprises are about as numerous as was the case in the preceding quarter and the 4-quarter average, but remain below the 12-quarter average.
Standout Sectors
Results in the Technology and Medical sectors have been notably better than expected. Autos, Industrial Products, Aerospace and Finance are some of the other sectors whose results came in better than expected. Growth is notably strong in the Construction sector, but the proportion of sector companies beating EPS and revenue estimates is tracking below the index’s level.
For the Technology sector, we now have results from 84.6% of the sector’s total market cap in the index. Total earnings for these Tech companies are down -0.9% from the same period last year on +2.1% higher revenues, with 83.3% beating EPS estimates and 77.8% beating revenue expectations.
The comparison charts below compare the sector’s results thus far with what these same Tech companies had reported in other recent periods.
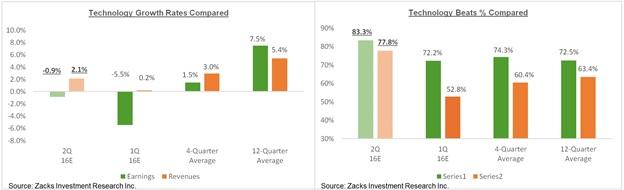
This is better growth performance than we have seen from the same group of Tech companies in the preceding quarter. With respect to positive surprises, they are tracking above historical periods for both earnings and revenue beats, as the comparison charts above show. No doubt market participants are so excited for the results from Facebook (NASDAQ:FB) (FB), Google’s parent Alphabet (NASDAQ:GOOGL) (GOOGL) and even Apple (NASDAQ:AAPL) (AAPL) and Microsoft (NASDAQ:MSFT) (MSFT).
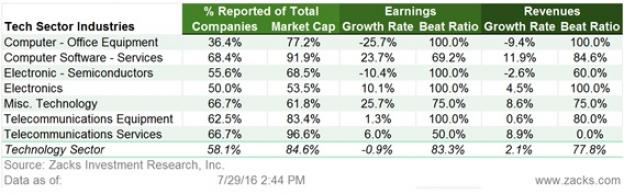
The table below shows the sector’s scorecard at the medium industry level. As you can see, all of the sector’s growth is coming from the Software/Services industry where Alphabet had +44.3% earnings growth on +22.1% higher revenues while Facebook had +158% growth in earnings on 59.2% higher revenues. The weak growth picture for the hardware industry (Computer – office Equipment) is due to Apple and IBM (NYSE:IBM), with Apple’s earnings down -27% on -14.6% lower revenues.
Expectations for the Quarter As a Whole
Looking at Q2 as a whole, combining the actual results from 317 index members with estimates for the still-to-come 183 companies, total S&P 500 earnings are expected to be down -3.4% on -0.4% lower revenues, with growth in negative territory for 8 of the 16 Zacks sectors. The Q2 growth pace has ‘improved’ as companies have come out with improved results, but the quarter is still on track to be in the negative for the 5th quarter in a row.
As has been the pattern in other recent periods, the Energy sector remains the biggest drag on the aggregate growth picture, with total earnings for the sector expected to be down -84% on -26% lower revenues. Excluding the Energy sector, earnings for the rest of the index would be up +0.3%.
The table below shows the summary picture for Q2 contrasted with what was actually achieved in the preceding period.
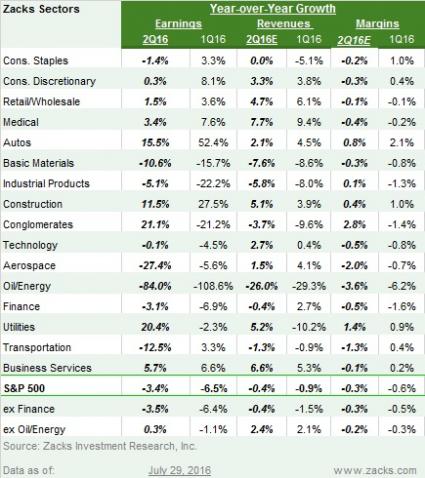
While Energy stands out for its very tough comparisons, there is not much positive growth coming from the other major sectors either. The Finance and Technology sectors, the two biggest earnings contributors in the S&P 500 index, are also expected to see earnings decline in Q2 from the year-earlier levels.
For the Finance sector, total Q2 earnings are expected to be down -3.1% on -0.4% lower revenues, which will follow -6.9% decline in the sector’s earnings in the preceding quarter.
The Technology sector, total earnings are expected to be down -0.1% on +2.7% higher revenues, which would follow the sector’s -4.5% earnings decline on +0.4% higher revenues in Q1. The big culprit for the Tech sector’s weak showing this quarter (as well as last one) is Apple (AAPL), whose June quarter earnings were down -27% on -14.6% lower revenues from the same period last year. Excluding Apple, the Tech sector’s Q2 earnings would be up +6.6% (Apple alone brings in roughly a fifth of the Tech sector’s total earnings).
On the positive side, Q2 earnings are expected be up at Autos (up +15.5%), Construction (+11.5%), Conglomerates (+21.1%), and Utilities (+20.4%). The Utilities and Conglomerate sectors’ strong growth numbers are solely due to easy comparisons at AES Corp (AES) and General Electric (NYSE:GE) (GE), respectively.
Expectations Beyond Q2
The chart below shows current quarterly earnings growth expectations for the index in 2016 Q2 and the following four quarters contrasted with actual declines in the preceding four quarters. As you can see, Q2 is on track to be the 5th quarter in row of earnings declines and estimates of Q3 growth starting to go deeper into negative territory as well.
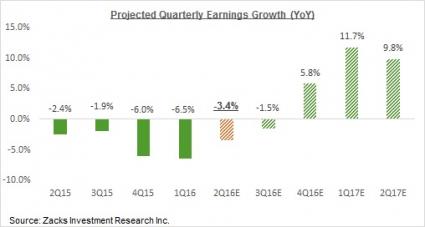
The only meaningful positive earnings growth this year is expected to come from the last quarter of the year, which is then expected to continue into 2017 when earnings for the S&P 500 index are expected to be up in double-digits. We will see if those estimates will hold up as we reach the last quarter of the year. But given what we have seen over the last few quarters, the odds don’t look that favorable.
Note: Sheraz Mian regularly provides earnings analysis on Zacks.com and appears frequently in the print and electronic media. In addition to this Earnings Preview article, he publishes the Zacks Earnings Trendsreport every week. If you want an email notification each time Sheraz publishes a new article, please click here.
Note: For a complete analysis of 2016 Q2 estimates, please check out weekly Earnings Trends report.
| Company | Ticker | Current Qtr | Year-Ago Qtr | Last EPS Surprise % | Report Day | Time |
| DIAMOND OFFSHOR | DO | -0.02 | 0.66 | 128.57% | Monday | BTO |
| AFFIL MANAGERS | AMG | 3.01 | 3.08 | 0.00% | Monday | BTO |
| LOEWS CORP | L | 0.57 | 0.46 | -42.31% | Monday | BTO |
| MEETME INC | MEET | 0.05 | 0.02 | 150.00% | Monday | BTO |
| DSP GROUP INC | DSPG | 0.01 | 0.04 | 23.53% | Monday | BTO |
| COMSTOCK RESOUR | CRK | -0.61 | -1.11 | -4.04% | Monday | BTO |
| ENGILITY HLDGS | EGL | 0.27 | 0.51 | 20.00% | Monday | BTO |
| EDUCATION RLTY | EDR | 0.38 | 0.41 | 14.89% | Monday | BTO |
| GENESEE & WYO | GWR | 0.78 | 0.93 | 8.45% | Monday | BTO |
| HAEMONETICS CP | HAE | 0.28 | 0.35 | -19.57% | Monday | BTO |
| BROADSOFT INC | BSFT | 0.01 | -0.2 | 250.00% | Monday | BTO |
| OLD NATL BCP | ONB | 0.25 | 0.25 | 8.70% | Monday | BTO |
| INSPERITY INC | NSP | 0.48 | 0.33 | 10.07% | Monday | BTO |
| STERLING CONSTR | STRL | 0.09 | -0.12 | -825.00% | Monday | BTO |
| MERCURY GENL CP | MCY | 0.5 | 0.64 | -81.16% | Monday | BTO |
| CHANGYOU.COM | CYOU | 0.56 | 0.84 | 10.91% | Monday | BTO |
| HAWAIIAN TELCOM | HCOM | N/A | 0.04 | -85.71% | Monday | BTO |
| SOHU.COM INC | SOHU | N/A | -0.7 | 9.09% | Monday | BTO |
| TECNOGLASS INC | TGLS | 0.22 | 0.17 | -5.56% | Monday | BTO |
| UCP INC | UCP | 0.05 | -0.08 | 233.33% | Monday | BTO |
| BOARDWALK PIPLN | BWP | 0.18 | 0.16 | 14.29% | Monday | BTO |
| CNA FINL CORP | CNA | 0.72 | 0.49 | 6.67% | Monday | BTO |
| GRACE (WR) NEW | GRA | 0.69 | 1.19 | 5.56% | Monday | BTO |
| FIRST DATA CORP | FDC | 0.28 | N/A | 33.33% | Monday | BTO |
| AMC ENTERTAINMT | AMC | 0.29 | 0.45 | 28.57% | Monday | BTO |
| MACERICH CO | MAC | 0.97 | 0.97 | 3.49% | Monday | AMC |
| ALLIANT ENGY CP | LNT | 0.37 | 0.34 | 0.00% | Monday | AMC |
| VULCAN MATLS CO | VMC | 0.99 | 0.66 | 333.33% | Monday | AMC |
| VORNADO RLTY TR | VNO | 1.25 | 1.71 | -13.01% | Monday | AMC |
| FRONTIER COMMUN | FTR | -0.04 | 0.03 | 111.11% | Monday | AMC |
| WILLIAMS COS | WMB | 0.19 | 0.15 | -70.00% | Monday | AMC |
| GENL GRWTH PPTY | GGP | 0.36 | 0.33 | 14.29% | Monday | AMC |
| DUN &BRADST-NEW | DNB | 1.18 | 1.25 | 25.53% | Monday | AMC |
| COGNEX CORP | CGNX | 0.44 | 0.49 | 54.55% | Monday | AMC |
| TRINSEO SA | TSE | 1.65 | 1.61 | 21.80% | Monday | AMC |
| DANAOS CORP | DAC | 0.43 | 0.35 | 2.38% | Monday | AMC |
| BG STAFFING INC | BGSF | 0.4 | 0.2 | 242.86% | Monday | AMC |
| POST PPTYS INC | PPS | 0.79 | 0.74 | 1.30% | Monday | AMC |
| GREEN PLAINS | GPRE | 0.03 | 0.19 | -350.00% | Monday | AMC |
| PRESS GANEY HLD | PGND | 0.21 | 0.18 | 11.11% | Monday | AMC |
| PETROQUEST ENGY | PQ | -0.52 | -1.04 | -57.89% | Monday | AMC |
| MID-CON ENERGY | MCEP | 0.12 | 0.04 | 14.29% | Monday | AMC |
| ATWOOD OCEANICS | ATW | 0.78 | 1.73 | 17.39% | Monday | AMC |
| TEXAS ROADHOUSE | TXRH | 0.44 | 0.3 | 1.85% | Monday | AMC |
| TENET HEALTH | THC | 0.49 | 0.75 | 36.36% | Monday | AMC |
| CYRUSONE INC | CONE | 0.6 | 0.5 | 5.00% | Monday | AMC |
| CEMPRA INC | CEMP | -0.67 | -0.57 | 3.17% | Monday | AMC |
| SABRA HEALTHCR | SBRA | 0.56 | 0.53 | 0.00% | Monday | AMC |
| REXNORD CORP | RXN | 0.3 | 0.3 | 2.78% | Monday | AMC |
| TREX COMPANY | TREX | 0.72 | 0.58 | 20.00% | Monday | AMC |
| GLAUKOS CORP | GKOS | -0.05 | -1.3 | 118.75% | Monday | AMC |
| ONE GAS INC | OGS | 0.31 | 0.23 | 3.39% | Monday | AMC |
| SYKES ENTRP INC | SYKE | 0.31 | 0.36 | 13.51% | Monday | AMC |
| AEGION CORP | AEGN | 0.25 | 0.35 | 50.00% | Monday | AMC |
| PREFERRED APTMT | APTS | 0.31 | 0.27 | -3.23% | Monday | AMC |
| ALEXANDRIA REAL | ARE | 1.37 | 1.31 | 0.00% | Monday | AMC |
| BLACKBAUD INC | BLKB | 0.38 | 0.31 | -9.09% | Monday | AMC |
| CHEGG INC | CHGG | -0.09 | -0.08 | 0.00% | Monday | AMC |
| GREEN PLAIN PTR | GPP | 0.4 | N/A | 0.00% | Monday | AMC |
| INTEGR DEVICE | IDTI | 0.3 | 0.26 | 14.29% | Monday | AMC |
| TRINET GROUP | TNET | 0.19 | 0.09 | 5.26% | Monday | AMC |
| UGI CORP | UGI | 0.08 | 0.03 | 0.00% | Monday | AMC |
| INTERACT INTELL | ININ | -0.35 | -0.17 | -20.00% | Monday | AMC |
| INSTRUCTURE INC | INST | -0.6 | N/A | 9.09% | Monday | AMC |
| INTEVAC INC | IVAC | -0.27 | -0.01 | 16.22% | Monday | AMC |
| OLIN CORP | OLN | 0.24 | 0.33 | -25.00% | Monday | AMC |
| DOUGLAS DYNAMIC | PLOW | 0.45 | 0.57 | -233.33% | Monday | AMC |
| FREIGHTCAR AMER | RAIL | 0.4 | 0.6 | -45.10% | Monday | AMC |
| VEECO INSTRS-DE | VECO | -0.31 | 0.08 | 33.33% | Monday | AMC |
| XO GROUP INC | XOXO | 0.12 | 0.13 | 33.33% | Monday | AMC |
| ADDUS HOMECARE | ADUS | 0.31 | 0.3 | -7.14% | Monday | AMC |
| ADV ENERGY INDS | AEIS | 0.62 | 0.41 | 23.26% | Monday | AMC |
| BLACK DIAMOND | BDE | 0.01 | 0.01 | -125.00% | Monday | AMC |
| EXACTECH INC | EXAC | 0.3 | 0.26 | 3.33% | Monday | AMC |
| GLADSTONE INVES | GAIN | 0.19 | 0.17 | -11.11% | Monday | AMC |
| HERITAGE OAKS | HEOP | 0.11 | 0.11 | 9.09% | Monday | AMC |
| AMKOR TECH INC | AMKR | -0.08 | 0.08 | 100.00% | Monday | AMC |
| BOVIE MEDICAL | BVX | -0.07 | -0.06 | -40.00% | Monday | AMC |
| CUTERA INC | CUTR | -0.01 | -0.08 | -7.69% | Monday | AMC |
| GREENLIGHT CAP | GLRE | -0.89 | -1.06 | Monday | AMC | |
| INNOPHOS HLDGS | IPHS | 0.5 | 0.65 | 57.14% | Monday | AMC |
| MACQUARIE INFRA | MIC | N/A | -0.8 | 57.14% | Monday | AMC |
| ORTHOFIX INTL | OFIX | 0.35 | 0.36 | 64.71% | Monday | AMC |
| PROVIDENCE SVC | PRSC | 0.68 | 0.67 | 17.07% | Monday | AMC |
| RESOURCE CAPITL | RSO | 0.62 | -0.96 | -20.34% | Monday | AMC |
| THESTREET.COM | TST | -0.03 | -0.02 | 0.00% | Monday | AMC |
| HEALTHCARE TRST | HTA | 0.41 | 0.38 | 0.00% | Monday | AMC |
| NAUTILUS INC | NLS | 0.09 | 0.07 | 5.56% | Monday | AMC |
| AMER CAP MTGE | MTGE | 0.41 | 0.52 | -10.20% | Monday | AMC |
| NATIONAL GNL HL | NGHC | 0.41 | 0.36 | 25.00% | Monday | AMC |
| WEST CORP | WSTC | 0.71 | 0.75 | 2.94% | Monday | AMC |
| BLUE CAP REINSR | BCRH | 0.37 | 0.63 | 29.55% | Monday | AMC |
| ENDURANCE SPLTY | ENH | 1.15 | 1.76 | 6.78% | Monday | AMC |
| HAVERTY FURNIT | HVT | 0.19 | 0.21 | -4.55% | Monday | AMC |
| T2 BIOSYSTEMS | TTOO | -0.54 | -0.54 | 0.00% | Monday | AMC |
| XTANT MEDICAL | XTNT | -0.4 | -0.41 | -4.44% | Monday | AMC |
| ATLAS FINL HLDG | AFH | 0.37 | 0.49 | -8.11% | Monday | AMC |
| AVINGER INC | AVGR | -1.18 | -0.83 | -10.34% | Monday | AMC |
| AMERIGAS PARTNR | APU | -0.42 | -0.53 | -46.77% | Monday | AMC |
| WILLIAMS PTR LP | WPZ | 0.16 | 0.14 | -165.79% | Monday | AMC |
| CARMIKE CINEMA | CKEC | 0.14 | 0.33 | -18.18% | Monday | AMC |
| RAYONIER ADV MT | RYAM | 0.28 | 0.39 | 100.00% | Monday | AMC |
| LTC PROPERTIES | LTC | 0.77 | 0.67 | 1.33% | Monday | N/A |
| HEINEKEN NV | HEINY | N/A | N/A | Monday | N/A | |
| MITSUBISHI-UFJ | MTU | N/A | 0.18 | Monday | N/A | |
| AETNA INC-NEW | AET | 2.11 | 2.05 | 3.60% | Tuesday | BTO |
| MALLINCKRODT PL | MNK | 2.01 | 2.05 | 16.86% | Tuesday | BTO |
| AMERISOURCEBRGN | ABC | 1.26 | 1.2 | 5.66% | Tuesday | BTO |
| SEAGATE TECH | STX | 0.6 | 0.77 | -42.11% | Tuesday | BTO |
| CUMMINS INC | CMI | 2.15 | 2.62 | 5.65% | Tuesday | BTO |
| WELLTOWER INC | HCN | 1.14 | 1.09 | 0.89% | Tuesday | BTO |
| PROCTER & GAMBL | PG | 0.74 | 1 | 6.17% | Tuesday | BTO |
| XYLEM INC | XYL | 0.47 | 0.43 | 2.94% | Tuesday | BTO |
| EXPEDITORS INTL | EXPD | 0.58 | 0.61 | -3.64% | Tuesday | BTO |
| PFIZER INC | PFE (NYSE:PFE) | 0.62 | 0.56 | 21.82% | Tuesday | BTO |
| ENTERGY CORP | ETR | 1.04 | 0.83 | 15.38% | Tuesday | BTO |
| ROYAL CARIBBEAN | RCL | 1.02 | 0.84 | 78.13% | Tuesday | BTO |
| MARTIN MRT-MATL | MLM | 2.04 | 1.22 | 122.58% | Tuesday | BTO |
| NISOURCE INC | NI | 0.06 | 0.18 | 1.69% | Tuesday | BTO |
| ARCHER DANIELS | ADM | 0.44 | 0.6 | -2.33% | Tuesday | BTO |
| DISCOVERY COM-A | DISCA | 0.61 | 0.49 | 4.55% | Tuesday | BTO |
| MOLSON COORS-B | TAP | 1.13 | 1.41 | 25.58% | Tuesday | BTO |
| CVS HEALTH CORP | CVS | 1.3 | 1.22 | 1.72% | Tuesday | BTO |
| EATON CORP PLC | ETN | 1.07 | 1.16 | 3.53% | Tuesday | BTO |
| EMERSON ELEC CO | EMR | 0.84 | 0.84 | 4.76% | Tuesday | BTO |
| CARDINAL HEALTH | CAH | 1.13 | 1 | 7.52% | Tuesday | BTO |
| ECOLAB INC | ECL | 1.08 | 1.08 | 1.32% | Tuesday | BTO |
| PINNACLE WEST | PNW | 1.17 | 1.1 | -69.23% | Tuesday | BTO |
| TERADATA CORP | TDC | 0.51 | 0.47 | 19.35% | Tuesday | BTO |
| HARRIS CORP | HRS | 1.44 | 1.32 | 3.57% | Tuesday | BTO |
| DISCOVERY COM-C | DISCK | 0.55 | 0.49 | 17.95% | Tuesday | BTO |
| PITNEY BOWES IN | PBI | 0.42 | 0.45 | -17.07% | Tuesday | BTO |
| MOSAIC CO/THE | MOS | 0.18 | 1.05 | 0.00% | Tuesday | BTO |
| WELLCARE HEALTH | WCG | 1.39 | 1.34 | 49.30% | Tuesday | BTO |
| OLYMPIC STEEL | ZEUS | 0.41 | -0.08 | 56.25% | Tuesday | BTO |
| NATL RETAIL PPT | NNN | 0.58 | 0.56 | 0.00% | Tuesday | BTO |
| ARMADA HOFFLER | AHH | 0.23 | 0.24 | 13.64% | Tuesday | BTO |
| HEADWATERS INC | HW | 0.41 | 0.4 | 30.00% | Tuesday | BTO |
| NJ RESOURCES | NJR | 0.15 | 0.03 | -1.09% | Tuesday | BTO |
| WESTERN REF LOG | WNRL | 0.38 | 0.34 | -15.15% | Tuesday | BTO |
| SUN CMNTYS INC | SUI | 0.82 | 0.87 | 2.27% | Tuesday | BTO |
| MAZOR ROBOTICS | MZOR | -0.21 | -0.1 | -26.32% | Tuesday | BTO |
| ROWAN COS PLC | RDC | 0.73 | 0.7 | 30.67% | Tuesday | BTO |
| MAGELLAN MDSTRM | MMP | 0.73 | 0.82 | 4.82% | Tuesday | BTO |
| TEREX CORP | TEX | 0.53 | 0.78 | -150.00% | Tuesday | BTO |
| TEAM HEALTH HLD | TMH | 0.66 | 0.7 | 6.90% | Tuesday | BTO |
| NUSTAR ENERGY | NS | 0.49 | 0.54 | 16.33% | Tuesday | BTO |
| CRESTWOOD EQTY | CEQP | 0.04 | -2.1 | 500.00% | Tuesday | BTO |
| SHIRE PLC-ADR | SHPG | 2.98 | 2.63 | 4.59% | Tuesday | BTO |
| ARDMORE SHIPPIN | ASC | 0.13 | 0.3 | 4.00% | Tuesday | BTO |
| HI-CRUSH PTNRS | HCLP | -0.23 | 0.31 | -166.67% | Tuesday | BTO |
| HOLLY EGY PTNRS | HEP | 0.44 | 0.34 | 10.64% | Tuesday | BTO |
| IDEXX LABS INC | IDXX | 0.62 | 0.6 | 10.87% | Tuesday | BTO |
| COBALT INTL EGY | CIE | -0.09 | -0.15 | 27.27% | Tuesday | BTO |
| INTELIQUENT INC | IQNT | 0.28 | 0.29 | 0.00% | Tuesday | BTO |
| RETAILMENOT INC | SALE | -0.05 | 0.01 | 33.33% | Tuesday | BTO |
| STONERIDGE INC | SRI | 0.31 | 0.25 | 24.00% | Tuesday | BTO |
| ACCO BRANDS CP | ACCO | 0.23 | 0.24 | 80.00% | Tuesday | BTO |
| ALLOT COMM LTD | ALLT | -0.06 | -0.15 | -83.33% | Tuesday | BTO |
| BIOCEPT INC | BIOC | -0.22 | -0.22 | -8.70% | Tuesday | BTO |
| CARBONITE INC | CARB | -0.07 | -0.1 | 138.89% | Tuesday | BTO |
| ENDURANCE INTL | EIGI | 0.26 | 0.17 | -26.32% | Tuesday | BTO |
| NUSTAR GP HLDGS | NSH | 0.36 | 0.37 | 14.71% | Tuesday | BTO |
| SODASTREAM INTL | SODA | 0.19 | 0.17 | 93.33% | Tuesday | BTO |
| ATKORE INTL GRP | ATKR | 0.33 | N/A | Tuesday | BTO | |
| ENERNOC INC | ENOC | -0.18 | -0.44 | 17.54% | Tuesday | BTO |
| GEO GRP INC/THE | GEO | 0.84 | 0.78 | 9.09% | Tuesday | BTO |
| KAMADA LTD | KMDA | -0.03 | -0.06 | 0.00% | Tuesday | BTO |
| LANDMARK INFRAS | LMRK | 0.09 | 0.18 | -117.65% | Tuesday | BTO |
| NORTHWEST NAT G | NWN | 0.08 | 0.08 | 13.82% | Tuesday | BTO |
| OXFORD IMMUNOTC | OXFD | -0.34 | -0.33 | -10.34% | Tuesday | BTO |
| FERRARI NV | RACE | 0.46 | N/A | 45.16% | Tuesday | BTO |
| SABRE CORP | SABR | 0.25 | 0.27 | 23.33% | Tuesday | BTO |
| VISHAY INTERTEC | VSH | 0.23 | 0.2 | 18.75% | Tuesday | BTO |
| WESTMORELAND CO | WLB | -0.41 | -0.82 | 2.06% | Tuesday | BTO |
| CBIZ INC | CBZ | 0.17 | 0.21 | 16.67% | Tuesday | BTO |
| FRESH DEL MONTE | FDP | 1.24 | 1.2 | 89.16% | Tuesday | BTO |
| II-VI INCORP | IIVI | 0.24 | 0.27 | 29.63% | Tuesday | BTO |
| KOPIN CORP | KOPN | -0.12 | 0.01 | 15.38% | Tuesday | BTO |
| AH BELO CORP | AHC | N/A | -0.03 | Tuesday | BTO | |
| HYATT HOTELS CP | H | 0.46 | 0.28 | 4.17% | Tuesday | BTO |
| CONSTELLIUM NV | CSTM | 0.2 | -0.68 | -152.94% | Tuesday | BTO |
| GENERAC HOLDING | GNRC | 0.6 | 0.5 | 9.52% | Tuesday | BTO |
| STEVEN MADDEN | SHOO | 0.42 | 0.4 | 0.00% | Tuesday | BTO |
| CHOICE HTL INTL | CHH | 0.67 | 0.62 | -7.89% | Tuesday | BTO |
| VONAGE HOLDINGS | VG | 0.07 | 0.09 | 66.67% | Tuesday | BTO |
| EDGEWELL PERSNL | EPC | 0.79 | 1.17 | 3.54% | Tuesday | BTO |
| RYMAN HOSPITLTY | RHP | 1.58 | 1.45 | -7.56% | Tuesday | BTO |
| BOFI HLDG INC | BOFI | 0.46 | 0.38 | 1.82% | Tuesday | BTO |
| NEW RESID INV | NRZ | 0.49 | 0.45 | -2.00% | Tuesday | BTO |
| AMTRUST FIN SVC | AFSI | 0.71 | 0.77 | 6.94% | Tuesday | BTO |
| INTERDIGITL INC | IDCC | 0.26 | 0.89 | 8.22% | Tuesday | BTO |
| INTREPID POTASH | IPI | -0.15 | -0.08 | -22.22% | Tuesday | BTO |
| JONES LANG LASL | JLL | 1.98 | 2.01 | 13.89% | Tuesday | BTO |
| COMPUGEN LTD | CGEN | -0.17 | -0.14 | -6.25% | Tuesday | BTO |
| GLATFELTER | GLT | 0.04 | 0.04 | -11.90% | Tuesday | BTO |
| OCH-ZIFF CAPTL | OZM | 0.07 | 0.18 | -8.33% | Tuesday | BTO |
| DISCOVERY COM-B | DISCB | 0.55 | 0.49 | 15.00% | Tuesday | BTO |
| KENNAMETAL INC | KMT | 0.45 | 0.46 | 54.17% | Tuesday | BTO |
| AVON PRODS INC | AVP | 0.03 | 0.11 | -450.00% | Tuesday | BTO |
| WESTERN REFING | WNR | 0.51 | 1.44 | -58.06% | Tuesday | BTO |
| SURGICAL CARE | SCAI | 0.43 | 0.43 | -32.26% | Tuesday | BTO |
| INTERCONTL HTLS | IHG | N/A | N/A | Tuesday | BTO | |
| CONCHO RESOURCS | CXO | 0.09 | 0.38 | -275.00% | Tuesday | AMC |
| NEWFIELD EXPL | NFX | 0.15 | 0.46 | 10.00% | Tuesday | AMC |
| DEVON ENERGY | DVN | -0.22 | 0.78 | 11.67% | Tuesday | AMC |
| FMC CORP | FMC | 0.67 | 0.7 | 11.54% | Tuesday | AMC |
| HANESBRANDS INC | HBI | 0.51 | 0.5 | 18.18% | Tuesday | AMC |
| ONEOK (NYSE:OKE) INC | OKE | 0.41 | 0.36 | -4.76% | Tuesday | AMC |
| CERNER CORP | CERN | 0.53 | 0.48 | 0.00% | Tuesday | AMC |
| FISERV INC | FISV | 1.08 | 0.95 | 3.92% | Tuesday | AMC |
| AMER INTL GRP | AIG | 0.91 | 1.39 | -34.34% | Tuesday | AMC |
| ELECTR ARTS INC | EA | -0.14 | 0.01 | 26.67% | Tuesday | AMC |
| FORTIVE CORP | FTV | 0.61 | N/A | Tuesday | AMC | |
| QORVO INC | QRVO | 0.86 | 0.78 | 23.19% | Tuesday | AMC |
| VERISK ANALYTIC | VRSK | 0.76 | 0.77 | -2.60% | Tuesday | AMC |
| BEACON ROOFING | BECN | 0.75 | 0.56 | 114.29% | Tuesday | AMC |
| HUDSON TECHNOLO | HDSN | 0.11 | 0.08 | 50.00% | Tuesday | AMC |
| REX ENERGY CORP | REXX | -0.14 | -0.24 | 12.90% | Tuesday | AMC |
| DIAMONDBACK EGY | FANG | 0.15 | 0.41 | 140.00% | Tuesday | AMC |
| SM ENERGY CO | SM | -0.71 | 0.49 | 0.00% | Tuesday | AMC |
| US SILICA HOLDI | SLCA | -0.23 | 0.08 | 32.14% | Tuesday | AMC |
| ONEOK PARTNERS | OKS | 0.53 | 0.44 | 8.33% | Tuesday | AMC |
| DOUGLAS EMMETT | DEI | 0.45 | 0.4 | 2.38% | Tuesday | AMC |
| KAR AUCTION SVC | KAR | 0.56 | 0.46 | 7.84% | Tuesday | AMC |
| AMSURG CORP | AMSG | 1.02 | 0.92 | 0.00% | Tuesday | AMC |
| MACK CALI CORP | CLI | 0.53 | 0.46 | -2.00% | Tuesday | AMC |
| RUBICON PROJECT | RUBI | -0.07 | -0.12 | 200.00% | Tuesday | AMC |
| SUPERNUS PHARMA | SUPN | 0.13 | 0.03 | 0.00% | Tuesday | AMC |
| VIPER ENERGY | VNOM | 0.08 | 0.1 | 33.33% | Tuesday | AMC |
| AVIS BUDGET GRP | CAR | 0.74 | 0.84 | -154.55% |