
Prudential Financial, Inc. PRU reported second-quarter 2016 operating income of $1.84 per share that missed the Zacks Consensus Estimate by 26.1%. Earnings also plunged 36.8% year over year.
Including the impact of one-time items, net income was $2.04 per share, down 32.8% year over year.
Total revenue decreased 5.5% year over year to $11.8 billion due to 9.4% lower premiums, 6.9% decline in policy charges and fee income, and 5.1% less asset management fees, commissions and other income.
Total benefits and expenses of $10.8 billion in the quarter inched up about 1% year over year. The increase was mainly due to higher interest credited to policyholders’ account balances, interest expenses, amortization of acquisition costs as well as general and administrative expenses.
Quarterly Segment Update
U.S. Retirement Solutions and Investment Management reported adjusted operating income of $870 million, down 11.3% year over year. The downside can be attributed to lower contribution from Retirement business as well as Individual Annuities businesses.
U.S. Individual Life and Group Insurance reported an adjusted operating loss of $201 million. The segment had posted an adjusted operating income of $312 million in the prior-year quarter. Loss incurred by Individual Life segment resulted in the underperformance.
International Insurance reported adjusted operating income of $803 million, down 4.6% year over year. The decline was due to lower contribution from Life Planner, Gibraltar Life, and Other operations.
Corporate and Other Operations reported adjusted operating loss of $415 million, wider than a loss of $294 million in the year-ago quarter.
As of Jun 30, 2016, Prudential Financial’s assets under management increased 7.1% to $1.268 trillion from $1.184 trillion as of Dec 31, 2015. Book value, a measure of the company’s net worth, was $76.55 per share as of Jun 30 2016, up 7.7% from $73.59 per share as of Jun 30, 2015.
PRUDENTIAL FINL Price, Consensus and EPS Surprise
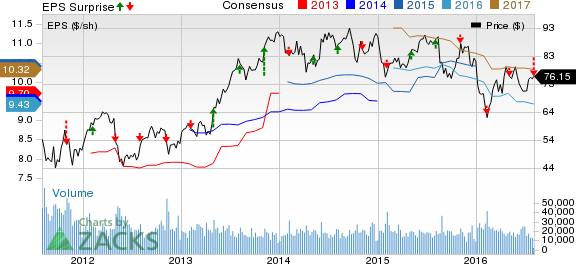
PRUDENTIAL FINL Price, Consensus and EPS Surprise | PRUDENTIAL FINL Quote
Zacks Rank and Performance of Other Multi-Line Insurers
Currently, Prudential Financial carries a Zacks Rank #3 (Hold). Among other multi line insurers that have reported their second-quarter earnings so far, the bottom line at Assurant (NYSE:AIZ), Inc. AIZ, CNO Financial Group, Inc. CNO and American International Group (NYSE:AIG), Inc. AIG beat their respective Zacks Consensus Estimates.
Want the latest recommendations from Zacks Investment Research? Today, you can download 7 Best Stocks for the Next 30 Days.Click to get this free report >>
AMER INTL GRP (AIG): Free Stock Analysis Report
ASSURANT INC (AIZ): Free Stock Analysis Report
CNO FINL GRP (CNO): Free Stock Analysis Report
PRUDENTIAL FINL (PRU): Free Stock Analysis Report
Original post
Zacks Investment Research