
Our recent calls for a bottom have been proven wrong as precious metals plunged to another new low. Two trading rules we have is to always use a 20% stop and never add to a losing position. Note our previous article in which we said use the late May low for a stop. This helps minimize risk and potential losses, though we have a handful of small losses trying to anticipate the coming rebound. We always admit mistakes to subscribers and we never blame manipulation. That is just unprofessional. That said, a close examination of history tells us that this could be the final capitulation that would lead directly to a huge rebound in the ensuing months.
Below we plot the four major downturns within the two secular bull markets in gold stocks. The HUI is now down 64% since 2011 and just surpassed by inches (in time and price) the 1968-1970 downturn. The Barron’s Gold Mining Index (BGMI) lost 67% from 1974-1976 before rising nearly 700% over the next four years.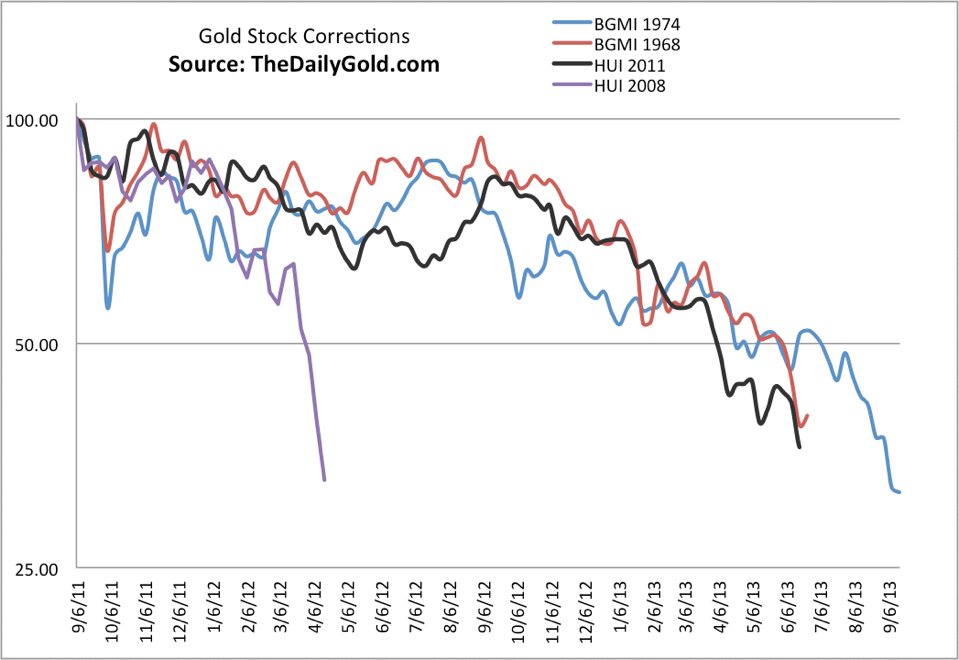
The Target
A 67% downturn would take the HUI down to 210. Interestingly, Fibonacci analysis shows that 210 lines up exactly with the HUI’s 2012 low and 2011 high. So 210 is a target to keep in mind. The GDX equivalent is $21.64.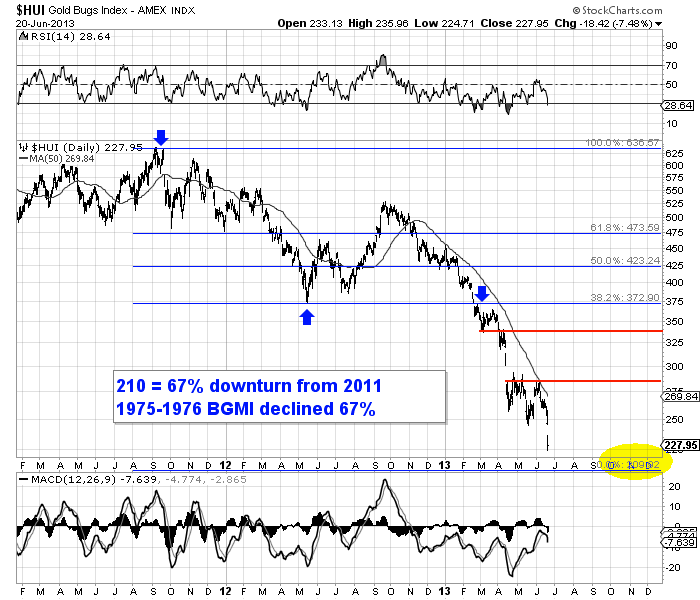
It’s important to note the 50-day moving average (or the 10-week moving average) as it plays a very important role in how gold stock bottoms evolve. Note that the HUI failed at the 50-day moving average at 283 and has already fallen to 228. Keep that in mind as we go over some important history.
Several months before the bottom at the start of 1970, the BGMI failed at the 10-week moving average. See the circle. From that point, the BGMI declined about 33% to its final bottom.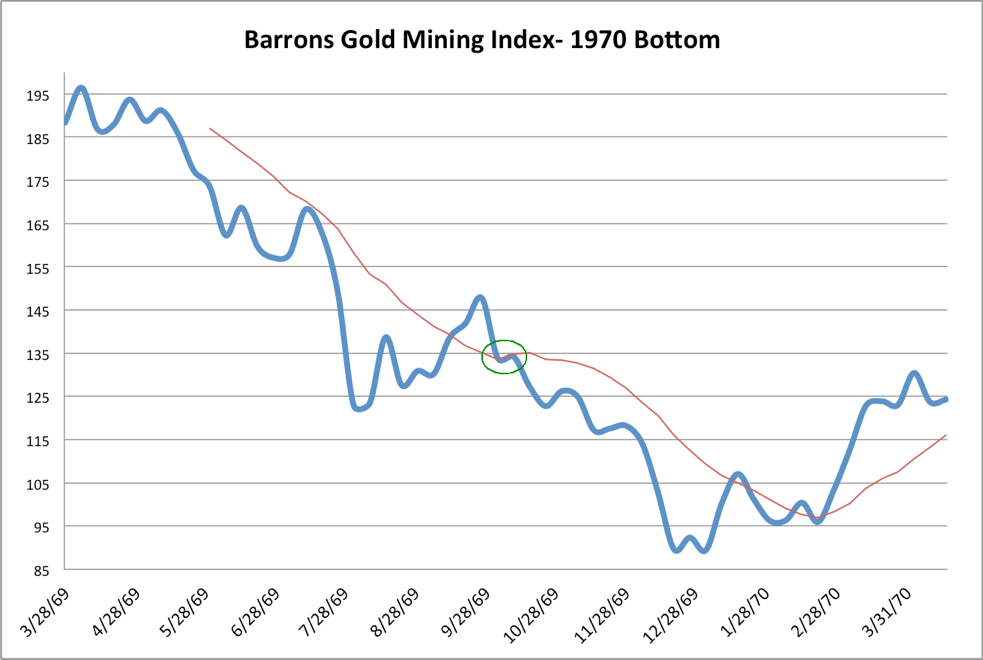
The BGMI failed at the 10-week moving average in summer of 1976. It declined about 35% to its final bottom.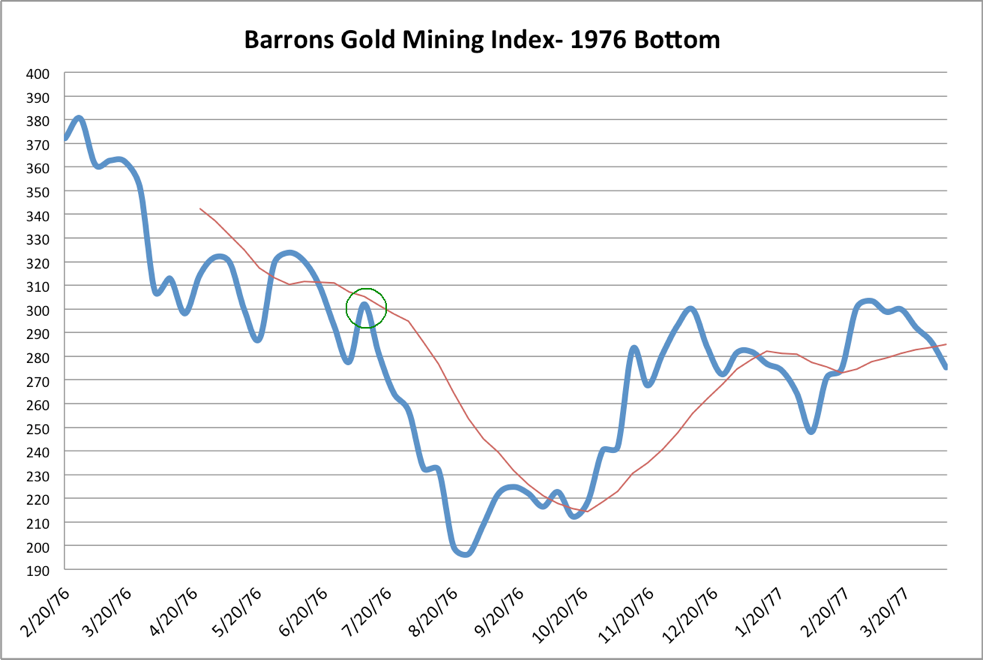
In September 2000, the HUI rallied above its 50-day moving average but eventually about 35% down to its final bottom.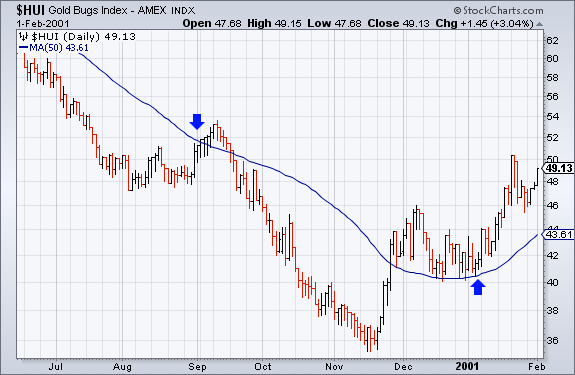
In September 2008, the HUI failed at its 50-day moving average. It then declined a whopping 57% before hitting its final bottom.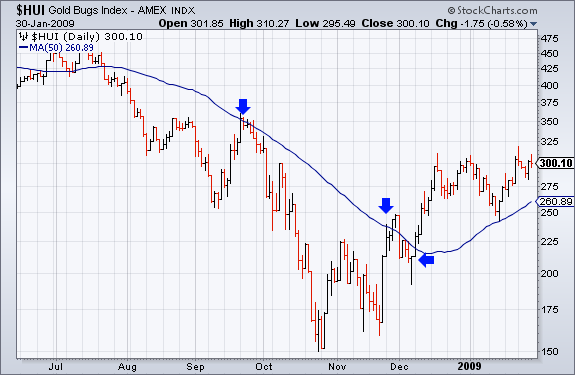
In three of the four cases, the market (after failing at the moving average) declined 33%-35% to its final bottom. At present, the HUI peaked at the moving average at 283. Note that at the recent failure of the 50-day moving average, the market was far more oversold than it was at that specific point in the four historical examples. Thus, we shouldn’t expect the same type of downturn. My downside target of 210 would mark a 26% decline from 283. It’s not 33%-35% but it is substantial.
MAs And The Bottom
If you take another look at the four charts, you’ll notice that the moving average plays a key role following the bottom. It provides initial resistance but once it gives way, the recovery begins in earnest. In the chart below we plot the paths of the recoveries that followed the four major bottoms discussed above. It’s not unreasonable to anticipate a 50% rebound in a four month period. In only four months the gold stocks rebounded 85% (starting in Q4 2008) and 60% (starting in Q4 2000).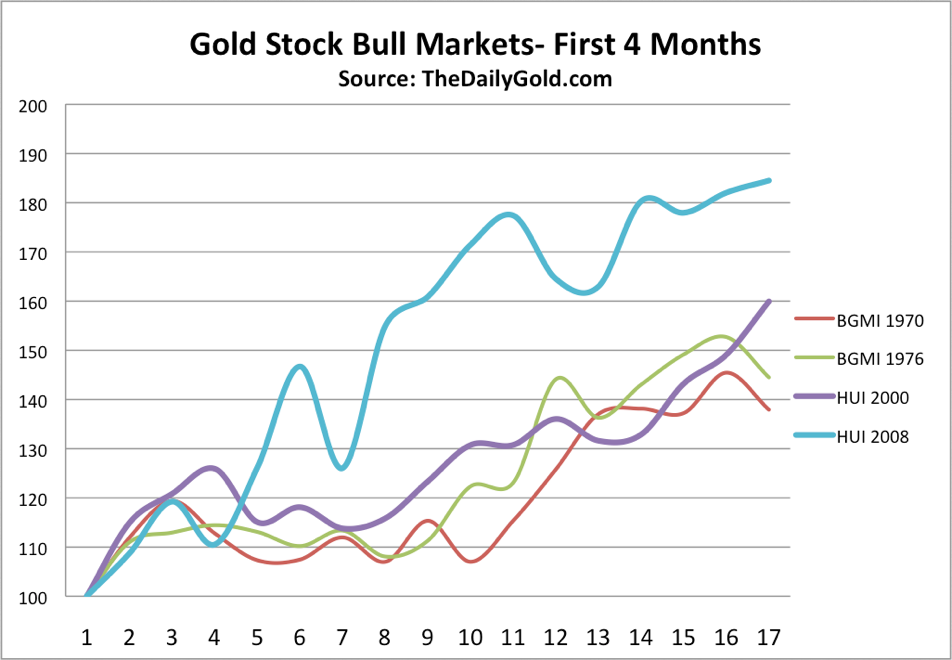
Gold is a speculative asset that is prone to big declines even in a secular bull market. When inflation is falling and the stock market is performing well, precious metals can really tumble. This is what occurred from 1975 to 1976 and during the last two years. Meanwhile, loose monetary policy and debt monetization since 2008 has already been factored in. Gold ran from $700 to $1900 and Silver surged almost 6-fold. Junior exploration companies went from pennies and dimes to $2 and $5. Junior producers went up 10-fold and more.
The cyclical bear market began with precious metals reaching very overbought conditions as noted above. Fundamentals slowly deteriorated as price inflation declined and Chindia (crucial for metals demand) slowed down economically. Global fear subsided. QE 3 was factored in but didn’t have a sustained impact above and beyond the aforementioned bearish factors. Furthermore, a major technical breakdown intensified the bear market.
Soon A Bottom
Currently, the precious metals complex is plunging but should find a bottom sooner rather than later. A catalyst is definitely needed for the complex to sustain a bottom. Twelve months from now we could see tremendous support for precious metals. The smartest guys are talking about the Fed doing more and not less. By smartest guys I’m talking about folks like Jeff Gundlach and John Brynjolfsson and not fanatical gold bugs. China will have to take action at somepoint to prevent a full blown credit collapse and deflationary spiral. The ECB is talking about pursuing unconventional measures and Mark Carney, the new chair at the BOE, would like to take more action. Does this sound like a bearish recipe for precious metals over the coming quarters?
It’s been a tough road for precious metals but the path ahead has strong potential of being significantly profitable and in a short period of time. The buying opportunity that we’ve spoken of for months could be days away. When precious metals equities rebound, they rebound violently.
Good Luck!
- English (UK)
- English (India)
- English (Canada)
- English (Australia)
- English (South Africa)
- English (Philippines)
- English (Nigeria)
- Deutsch
- Español (España)
- Español (México)
- Français
- Italiano
- Nederlands
- Português (Portugal)
- Polski
- Português (Brasil)
- Русский
- Türkçe
- العربية
- Ελληνικά
- Svenska
- Suomi
- עברית
- 日本語
- 한국어
- 简体中文
- 繁體中文
- Bahasa Indonesia
- Bahasa Melayu
- ไทย
- Tiếng Việt
- हिंदी
Precious Metals: Final Capitulation Ahead
Published 06/21/2013, 04:41 PM
Updated 07/09/2023, 06:31 AM
Precious Metals: Final Capitulation Ahead
Latest comments
Loading next article…
Install Our App
Risk Disclosure: Trading in financial instruments and/or cryptocurrencies involves high risks including the risk of losing some, or all, of your investment amount, and may not be suitable for all investors. Prices of cryptocurrencies are extremely volatile and may be affected by external factors such as financial, regulatory or political events. Trading on margin increases the financial risks.
Before deciding to trade in financial instrument or cryptocurrencies you should be fully informed of the risks and costs associated with trading the financial markets, carefully consider your investment objectives, level of experience, and risk appetite, and seek professional advice where needed.
Fusion Media would like to remind you that the data contained in this website is not necessarily real-time nor accurate. The data and prices on the website are not necessarily provided by any market or exchange, but may be provided by market makers, and so prices may not be accurate and may differ from the actual price at any given market, meaning prices are indicative and not appropriate for trading purposes. Fusion Media and any provider of the data contained in this website will not accept liability for any loss or damage as a result of your trading, or your reliance on the information contained within this website.
It is prohibited to use, store, reproduce, display, modify, transmit or distribute the data contained in this website without the explicit prior written permission of Fusion Media and/or the data provider. All intellectual property rights are reserved by the providers and/or the exchange providing the data contained in this website.
Fusion Media may be compensated by the advertisers that appear on the website, based on your interaction with the advertisements or advertisers.
© 2007-2024 - Fusion Media Limited. All Rights Reserved.