
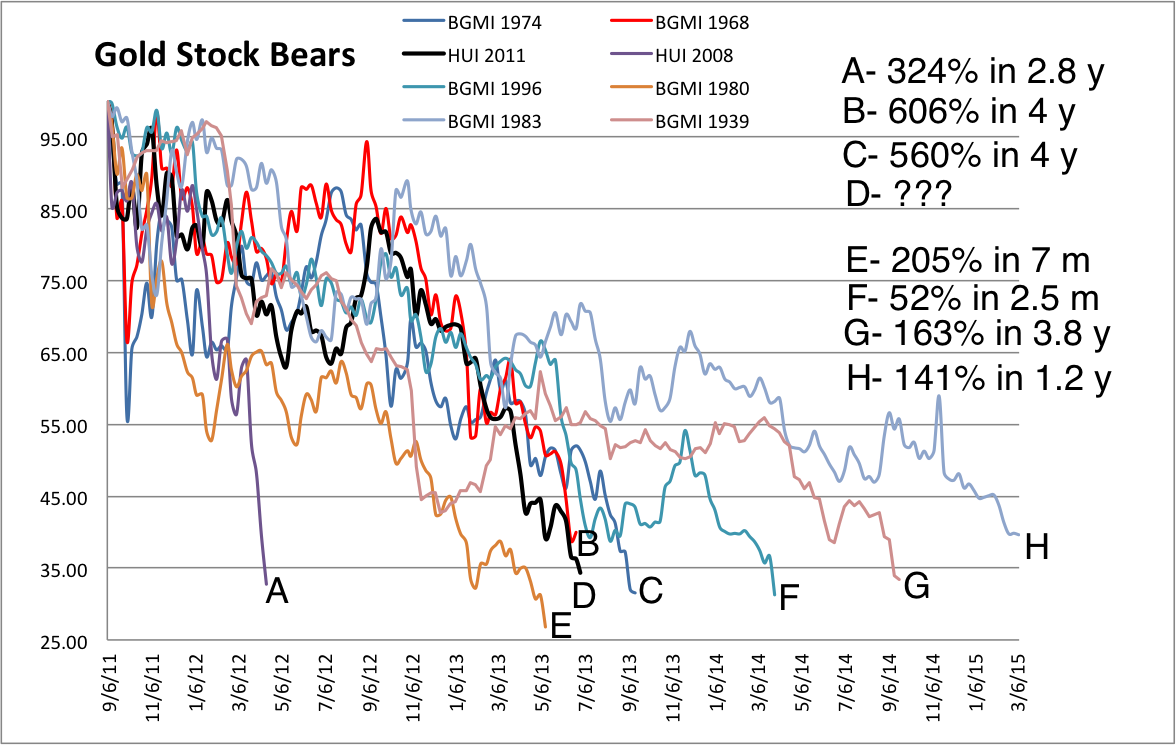
Obviously, we can’t know if the bottom is in but I’ll repost a chart that is my best argument for why we can expect a big rebound over the coming months. The chart shows all of the worst bear markets in gold stocks. At the top right I’ve annotated the ensuing recoveries. As you can see, D (the HUI from its 2011 top to last Friday’s close) is extremely close to B and C in terms of depth and duration. B and C occurred in a secular bull market and were followed by 606% and 560% gains. D is also close to E which was followed by a 205% gain in seven months. A, the 2008 collapse was followed by a 324% gain in less than three years.
Jibes With History
The chart and data show that the recent downturn is well in-line with the history of gold stocks and more importantly, is well in-line with downturns in secular bull markets. Yet, the mainstream is acting as if gold stocks are going to go 0 and the industry extinct. The recent drivel from talking heads on CNBC and Yahoo Finance is exactly what you get at a major bottom. Simply put, it is the perfect contrarian opportunity and is the foundation needed for a cyclical bull market and future bubble.
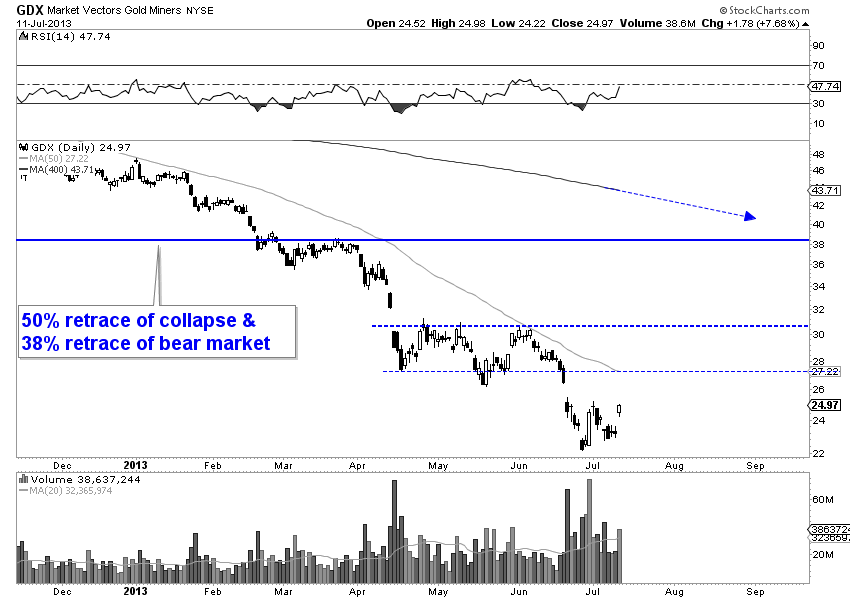
Moving along, the gold stocks have a very strong resistance target that could come into play in Q4 of this year. Market Vectors Gold Miners (GDX), the large-cap unhedged miners ETF has a confluence of retracement points near $38. Meanwhile, the current 400-day MA is at $43.71 and will likely come down to $38 before the end of the year. Following four major bottoms (1970, 1976, 2000 and 2008), the recovery hit that resistance (400-day MA) in the fourth or fifth month post-bottom. Finally, GDX’s low is at $22 and there is some critical resistance at $30. A very complex head and shoulders pattern could be developing and that would target $38. In the meantime, both the 50-day moving average and lateral resistance are at $27, which is the next key resistance.
HUI Rally
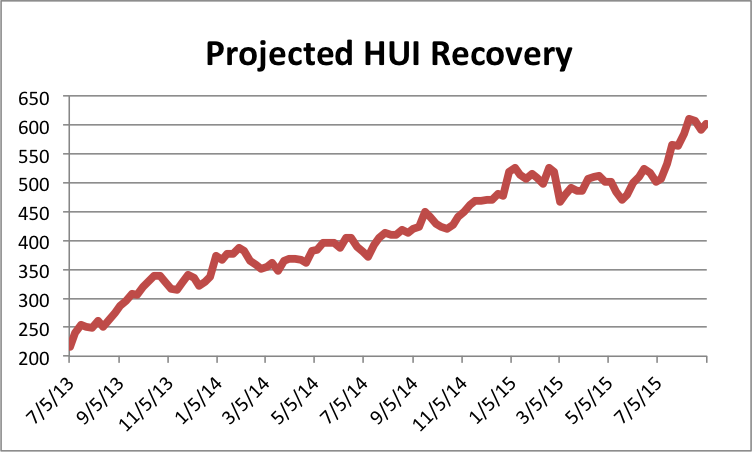
The equivalent to the GDX $38 target for the HUI is ~365. We looked at the price action following the major bottoms of gold stocks within a secular bull (1970, 1976, 2000, 2008) and combined the data into one. We applied that to last Friday’s close (215) and the result is below. The recovery template has the HUI rallying to 350 and then correcting for a few months before rallying up to 390. Then the HUI consolidates for another five months before breaking past 400 in August 2014.
We Did The Same Thing With Gold
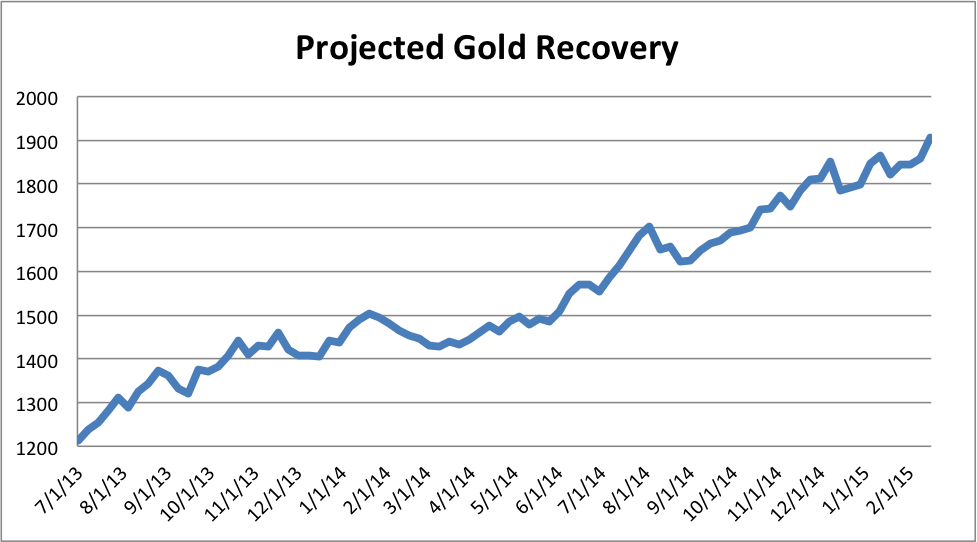
We looked at how Gold performed following its bottoms in 2004, 2006 and 2008 and merged the data into one. Then we applied it to last week’s close of $1212. (Note that we did not include 1976. If we did the recovery template would be much stronger). The projection shows Gold’s initial rebound peaking around $1500 in February 2014. Then it would consolidate until next summer. This makes sense considering the big breakdown occurred just above $1500. It is likely to mark the first big resistance post-bottom.
The projection shows Gold breaking past $1900 about 18 months from now. That would mark about three and a half years since the summer 2011 peak. After its peak in 1974, it took Gold three years to retest the high and three and a half years to make a new all time high.
To sum things up, we can’t know for sure if Gold has already bottomed or not. If it isn’t look for $1080 to be the final low. Regardless, our gold stock bears chart illustrates that we are on the cusp of a major bottom. It may already be in or it could happen in a few weeks. We don’t know. On the other hand we do know that each passing day and week brings us much closer to a probable big recovery. Those who have the courage to buy any weakness will be handsomely rewarded and history shows us it usually is in short order. I’m sitting on losses and hope the bottom is already in. More important is the fact that the medium term potential far outweighs the risk of a final minor leg down. Moreover, some individual stocks have already bottomed or will confirm their bottoms if there is a minor leg down.
- English (UK)
- English (India)
- English (Canada)
- English (Australia)
- English (South Africa)
- English (Philippines)
- English (Nigeria)
- Deutsch
- Español (España)
- Español (México)
- Français
- Italiano
- Nederlands
- Português (Portugal)
- Polski
- Português (Brasil)
- Русский
- Türkçe
- العربية
- Ελληνικά
- Svenska
- Suomi
- עברית
- 日本語
- 한국어
- 简体中文
- 繁體中文
- Bahasa Indonesia
- Bahasa Melayu
- ไทย
- Tiếng Việt
- हिंदी
Potential Upside Targets For Gold, Gold Stocks
Published 07/12/2013, 07:28 AM
Updated 07/09/2023, 06:31 AM
Potential Upside Targets For Gold, Gold Stocks
3rd party Ad. Not an offer or recommendation by Investing.com. See disclosure here or
remove ads
.
Latest comments
Install Our App
Risk Disclosure: Trading in financial instruments and/or cryptocurrencies involves high risks including the risk of losing some, or all, of your investment amount, and may not be suitable for all investors. Prices of cryptocurrencies are extremely volatile and may be affected by external factors such as financial, regulatory or political events. Trading on margin increases the financial risks.
Before deciding to trade in financial instrument or cryptocurrencies you should be fully informed of the risks and costs associated with trading the financial markets, carefully consider your investment objectives, level of experience, and risk appetite, and seek professional advice where needed.
Fusion Media would like to remind you that the data contained in this website is not necessarily real-time nor accurate. The data and prices on the website are not necessarily provided by any market or exchange, but may be provided by market makers, and so prices may not be accurate and may differ from the actual price at any given market, meaning prices are indicative and not appropriate for trading purposes. Fusion Media and any provider of the data contained in this website will not accept liability for any loss or damage as a result of your trading, or your reliance on the information contained within this website.
It is prohibited to use, store, reproduce, display, modify, transmit or distribute the data contained in this website without the explicit prior written permission of Fusion Media and/or the data provider. All intellectual property rights are reserved by the providers and/or the exchange providing the data contained in this website.
Fusion Media may be compensated by the advertisers that appear on the website, based on your interaction with the advertisements or advertisers.
© 2007-2024 - Fusion Media Limited. All Rights Reserved.