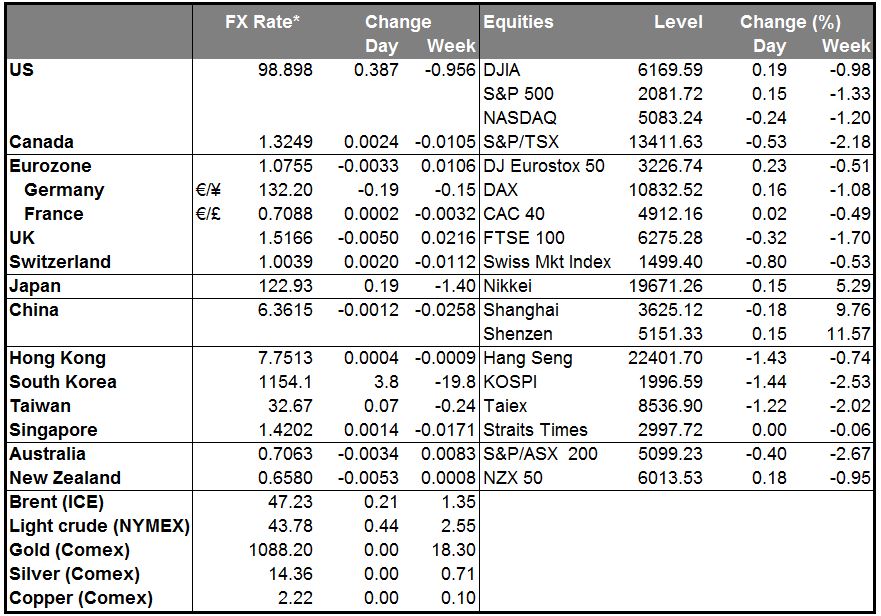
• Portugal’s left-wing parties ousts the minority government Portugal’s minority government collapsed on Tuesday, as left-wing parties ousted the ruling center-right party just six weeks after the country’s inconclusive elections. It is now up to the head of state to decide who should lead the next government as Portuguese law prohibits elections for six months. The prospect of a government that supports an end to austerity and increase to incomes, leads investors to take aim against the Lisbon’s stock market, which fell more than 4% in two days. A key point of concern in the markets will be Portugal’s credit rating review end of this week, by the last one of the four agencies that still rank the country as investment grade. A one-notch downgrade would send Portuguese debt into junk territory. As a result, it will not be qualified for the ECB’s expanded asset purchase program. What’s more, this could trigger a turmoil in the European stock markets and provide an excuse for some profit-taking.
• Even though expectations of more ECB easing coupled with the high probability of a Fed rate hike in December are the main forces behind EUR/USD moves, political uncertainty is unlikely provide support to the common currency and could keep it under selling pressure.
• Chinese data shows no significant improvement China released several indicators during Asian trading session that showed no significant improvement from the previous month. Retail sales were slightly higher in October, while the fixed asset investment and industrial production declined in pace, despite the plethora of measures the government has been taking to shore up the economy. This underscores the limited impact that the measures so far have had and the difficulties the country will have in boosting growth. We believe that fiscal policy, along with the loose monetary policy is needed to stabilize slowdown of the economy.
• Today’s highlights: The European day is relatively light as we have holidays in Canada and the US. The spotlight will be the UK employment report for September. The forecast is for the unemployment rate to have remained unchanged at 5.4%, while average weekly earnings are expected to have accelerated to 3.2% yoy from 3.0% yoy the previous month. Further improvement in the UK job market is likely to support Cable, which could continue recovering some of its losses caused by the BoE’s dovish stance last Thursday and the strong US employment report on Friday.
• As for the speakers, ECB Vice-President Vitor Constancio speaks. ECB President Mario Draghi and BoE Gov. Mark Carney speak at a forum held by the Bank of England.
The Market
EUR/USD rebounds from 1.0675
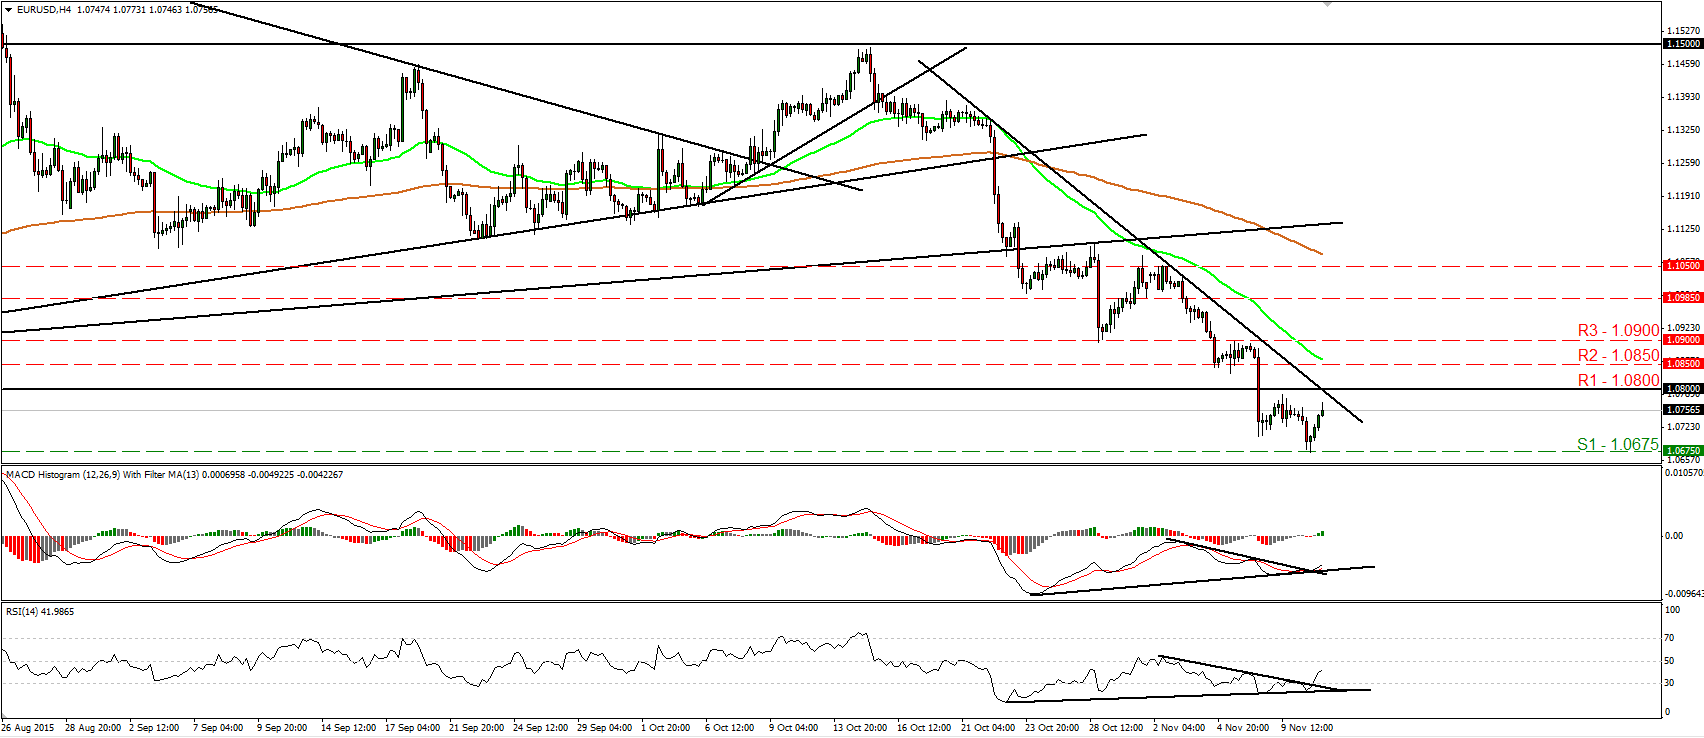
• EUR/USD traded lower yesterday, but found support at 1.0675 (S1) and then it rebounded. The price structure on the 4-hour chart is still lower peaks and lower troughs below the downtrend line taken from the peak of the 21st of October. However, although this keeps the near-term outlook to the downside, I see signs that the current rebound may continue for a while. The rate is now approaching the crossroad between the aforementioned downtrend line and the 1.0800 (R1) key hurdle. A clear move above 1.0800 (R1) is likely to confirm the continuation of the corrective bounce and perhaps challenge our next resistance of 1.0850 (R2). This is also supported by our short-term oscillators. The RSI edged higher after exiting its oversold territory, while the MACD has bottomed and crossed above its trigger line. What is more, there is positive divergence between both these indicators and the price action. In the bigger picture, the break below the key support (turned into resistance) area of 1.0800 (R1) on the 6th of November signaled the downside exit from the sideways range the pair had been trading since the last days of April. In my view, this has turned the longer-term outlook negative as well and corroborates my view to treat any possible further advances as a corrective move before sellers take the reins again.
• Support: 1.0675 (S1), 1.0625 (S2), 1.0570 (S3)
• Resistance: 1.0800 (R1), 1.0850 (R2), 1.0900 (R3)
GBP/USD trades higher ahead of the UK employment report
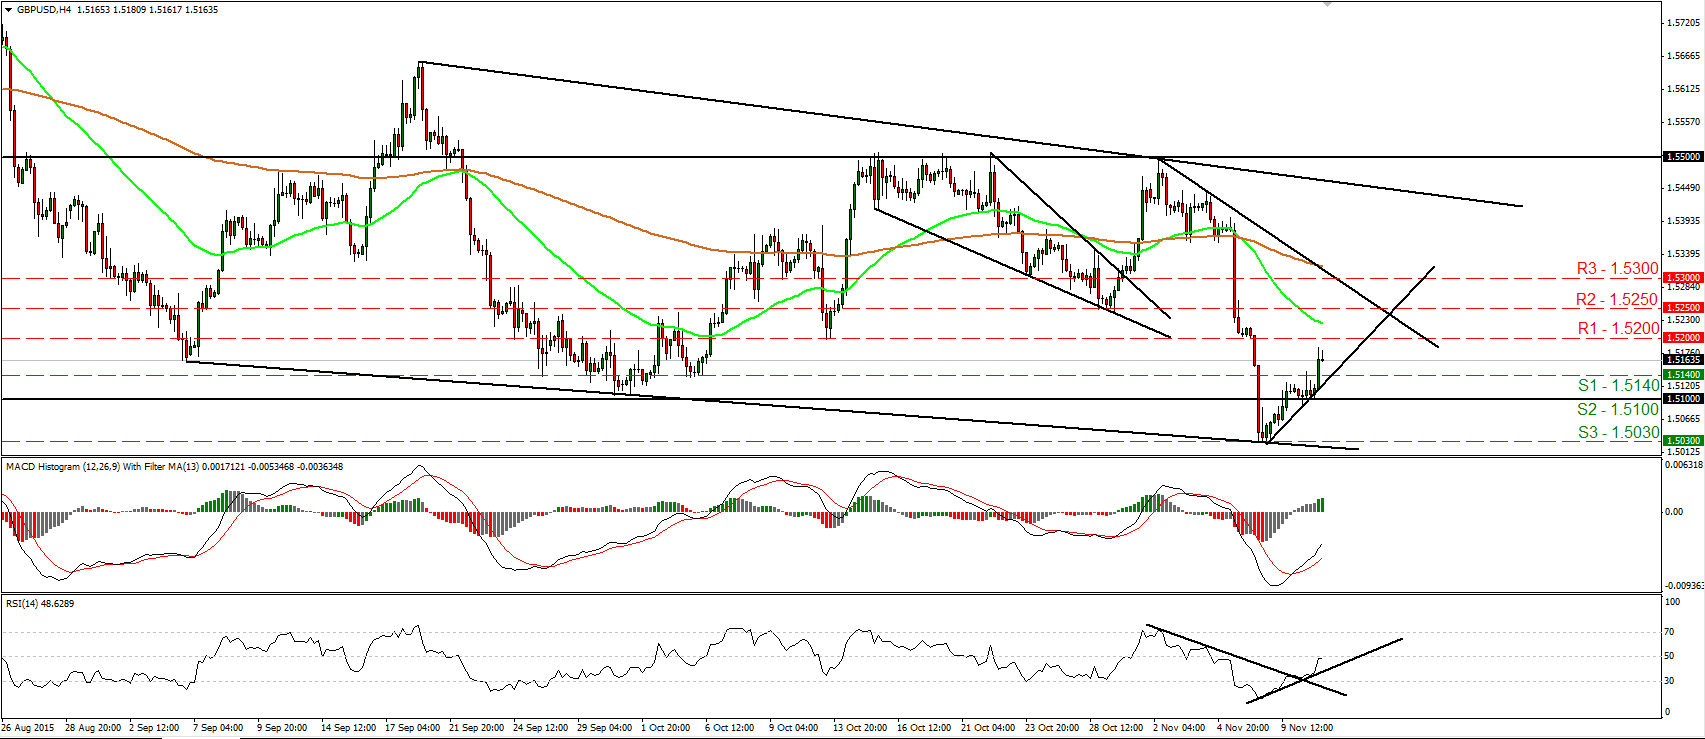
• GBP/USD traded higher yesterday, breaking above the resistance (now turned into support) zone of 1.5140 (S1). The rate now looks to be headed towards the 1.5200 (R1) barrier, where a clear break could extend the positive move towards our next resistance of 1.5250 (R2). Today we get the UK employment report for September, where the unemployment rate is expected to have remained unchanged but average weekly earnings are forecast to have accelerated. This could be the trigger for a move above the 1.5200 (R1) zone. Our short-term momentum studies support the notion as well. The RSI moved higher and is now testing its 50 line, while the MACD, although negative, emerged above its trigger line and is now pointing north. Switching to the daily chart, I see that the rate is trading well below the 80-day exponential moving average, which has started turning down. Therefore, I would see a cautiously negative longer-term picture and I would treat the recent rebound or any extensions of it that stay limited below the 80-day EMA as a corrective phase for now.
• Support: 1.5140 (S1), 1.5100 (S2), 1.5030 (S3)
• Resistance: 1.5200 (R1), 1.5250 (R2), 1.5300 (R3)
EUR/JPY trades in a sideways mode
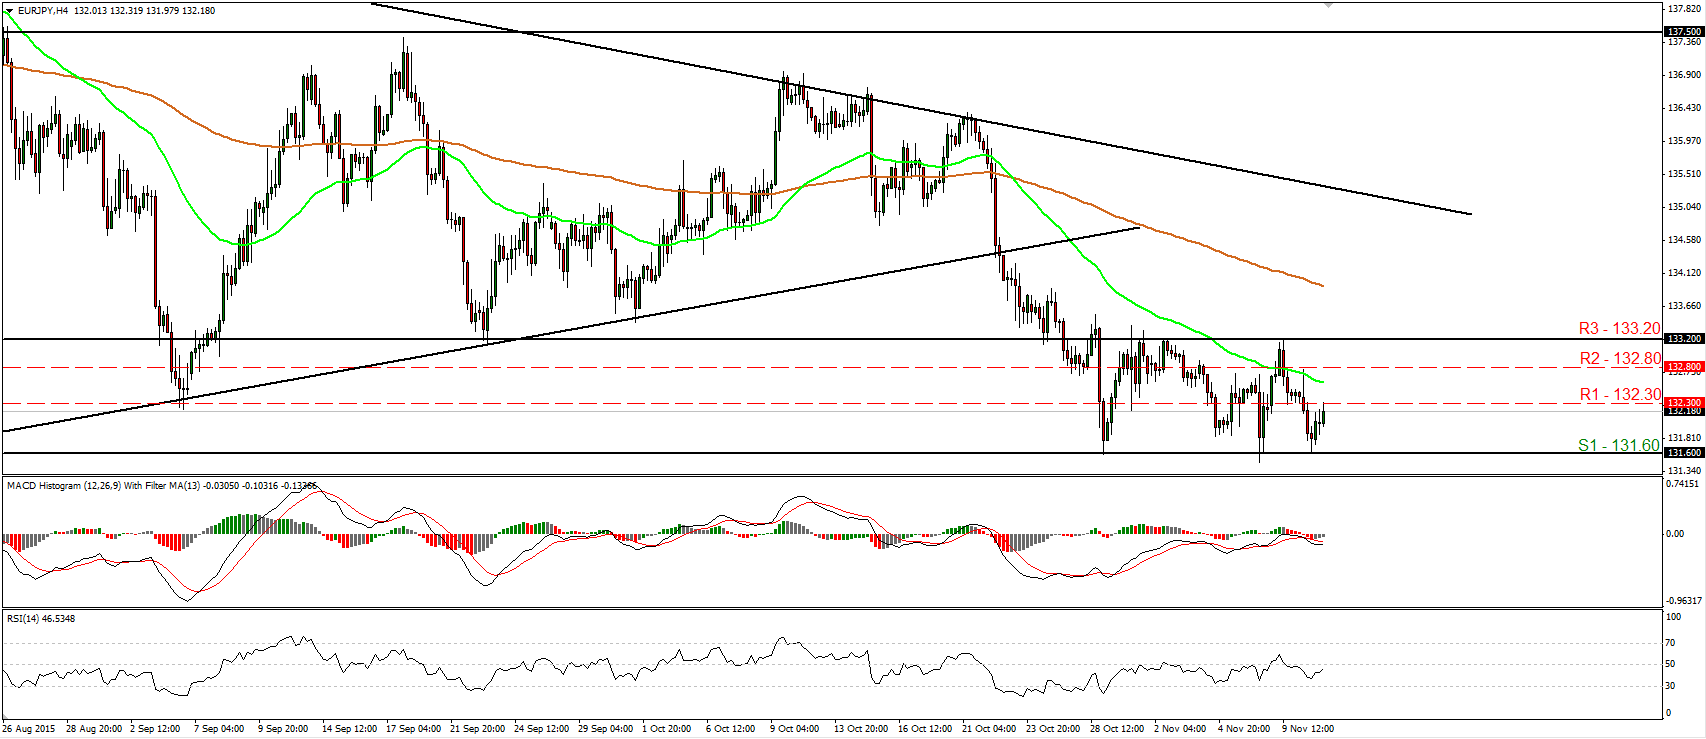
• EUR/JPY traded higher on Tuesday after it hit once again support near the 131.60 (S1) support obstacle. The pair has been trading in a sideways mode since the 28th of October, between the aforementioned support and the resistance zone of 133.20 (R3). As a result, I would consider the short-term picture of this pair to be flat. For now however, given the rebound from the lower bound of the range, I see the likelihood for the rate to continue higher. A break above 132.30 (R1) could reaffirm the case and could prompt extensions towards our next resistance at 132.80 (R2). Our short-term oscillators corroborate somewhat that view. The RSI has turned up again and could move above its 50 line soon, while the MACD, shows signs of bottoming slightly below its zero line. As for the broader trend, on the 22nd of October, the rate fell below the upside support line taken from the low of the 14th of April. However, I prefer to see a clear close below the key support zone of 131.60 (S1) before I get more confident on larger longer-term declines.
• Support: 131.60 (S1), 131.00 (S2), 130.20 (S3)
• Resistance: 132.30 (R1), 132.80 (R2), 133.20 (R3)
Gold rebounds again from 1085
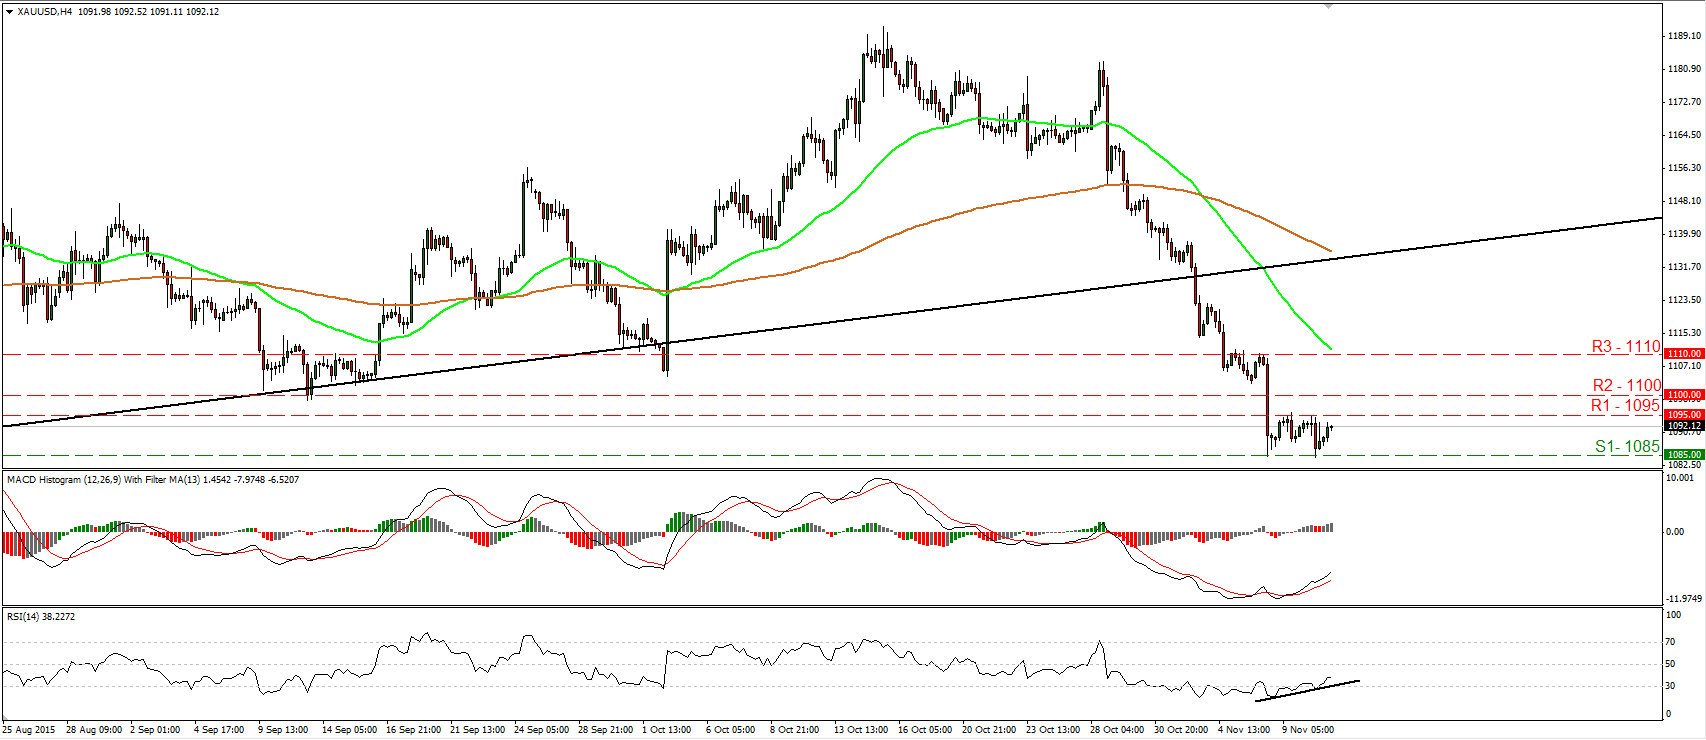
• Gold traded lower on Tuesday, but hit support again at 1085 (S1) and rebounded to trade back near the 1095 (R1) resistance hurdle. The short-term trend is still negative in my view and therefore, I would expect the bears to take control again at some point and push the price for another test at 1085 (S1). A move below 1085 (S1) could aim for our next support of 1080 (S2). Nevertheless, looking at our short-term oscillators, I see signs for further upside corrective rebound before sellers decide to shoot again. The RSI moved higher after it exited its below-30 zone, while the MACD, already above its trigger line, continued north and could be headed towards its zero line. A break above 1095 (R1) could confirm further rebound and is likely to challenge the 1100 (R2) zone as a resistance this time. On the daily chart, the plunge below the upside support line taken from the low of the 20th of July has shifted the medium-term outlook to the downside. As a result, I would treat any further short-term advances as a corrective move for now. I believe that the metal is poised to trade lower in the foreseeable future.
Support: 1085 (S1), 1080 (S2), 1072 (S3)
• Resistance: 1095 (R1), 1100 (R2), 1110 (R3)
DAX futures trades below a short-term uptrend line
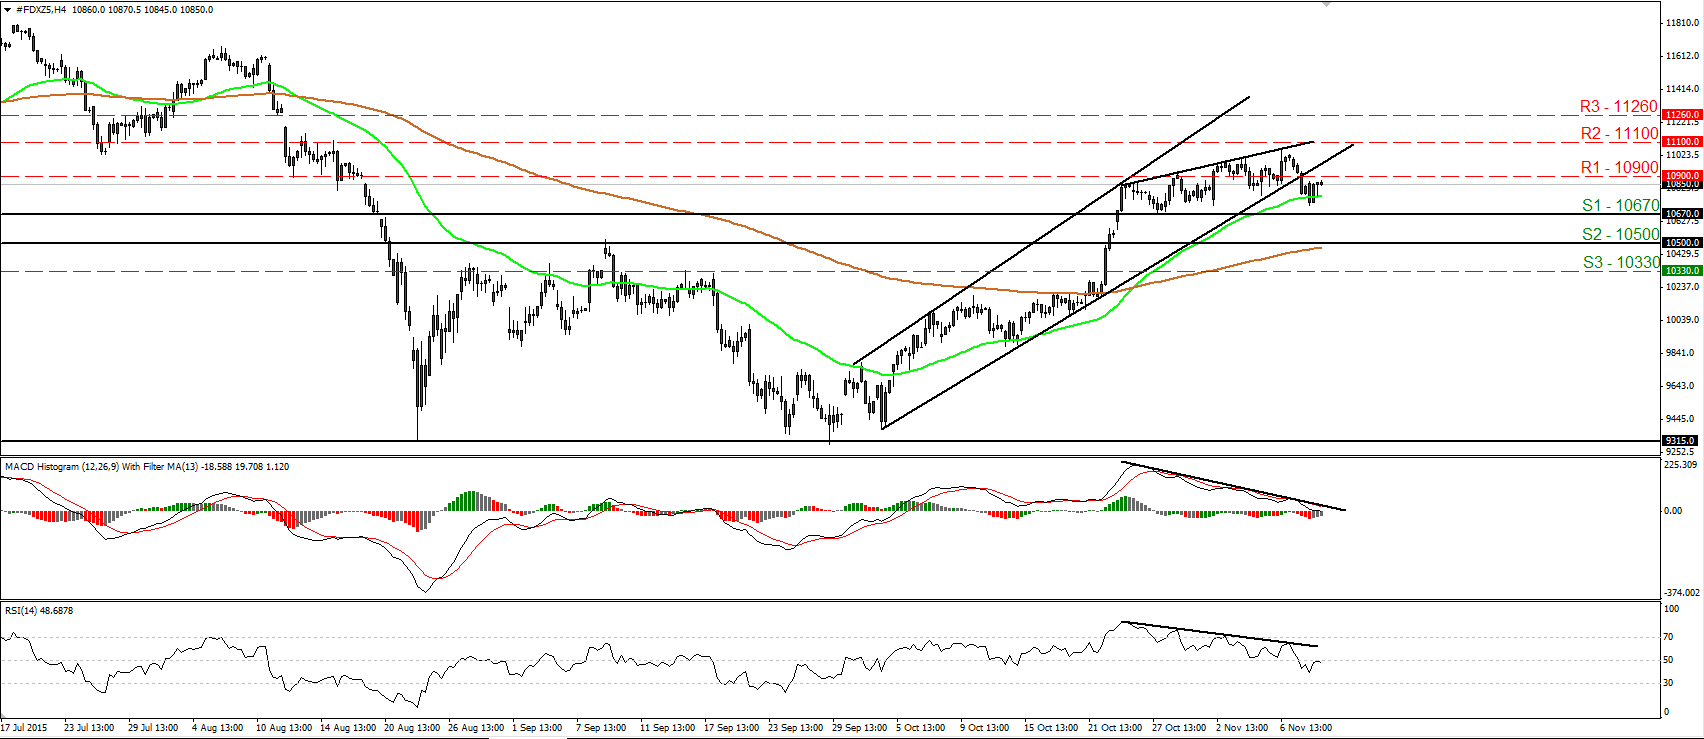
• DAX futures fell below the uptrend line taken from the low of the 2nd of October and subsequently, they consolidated below the 10900 (R1) zone. Taking into account the break below the trend line and having in mind our momentum signs, I see the possibility for the index to correct lower in the near term. The RSI turned down after it hit 50, while the MACD, already below its trigger line, looks ready to turn negative. There is also negative divergence between both the indicators and the price action. A decisive dip below the 10670 (S1) line could confirm further correction and could challenge the psychological zone of 10500 (S2) as a support this time. On the daily chart, the break above the psychological zone of 10500 (S2) on the 22nd of October signalled the completion of a double bottom formation. This keeps the medium-term outlook positive and as a result, I would consider any future short-term declines as a retracement for now.
• Support: 10670 (S1), 10500 (S2), 10330 (S3)
• Resistance: 10900 (R1), 11100 (R2), 11260 (R3)

