While the major equity indexes continue to scrape and crawl their way higher in this market bounce, many of the following markets left for dead have now entered NEW bull markets: Greece, Russia, Brazil, Crude Oil, Oil Service, Energy MLPs, Gold, Metal and Miners, and even the Transports. After years of outperformance from the FANG and Momentum stocks, the market of 2016 is seeing a shift toward underperforming, highly leveraged, worst quality companies and geographies that it can find. While low valuations were fuel for the fire, the shift still needed a catalyst and the sparks seemed to have come from the continued lift in oil prices and a new ravenous demand for High Yield bonds. Helping the low quality move has been trend following strategies who continue to be forced into covering their equity and commodity shorts on each new move higher. As the upward move continues, those Portfolio Managers concentrated in High Quality will be forced into reducing their holdings to participate in some of these new bull markets or fear looking at significant underperformance to start 2016. Hopefully these firms did not fire all of their Energy and Latin American intelligence during the last 12 months of underperformance.
Friday’s jobs data was mixed and thus probably not enough to cause a Fed rate hike at the next meeting. But there has been a shift in expectations from the market toward at least one Fed rate hike before year end. Politics remain an active sideshow. If you are not enjoying the House of Cards in this election cycle, turn off the news and blogs and get back to looking at the oversold markets that you have laughed at for years. Keep an eye on the China data points as everyone expects the data to be terrible. That is your opportunity across many different market segments if they arrive in line or slightly better.
A look at the market bounce today versus the bounce in October shows some notable differences…
The October bounce had help from High Yield Bonds. This time we also have oil prices and Small Cap outperformance helping to fuel buying appetites.
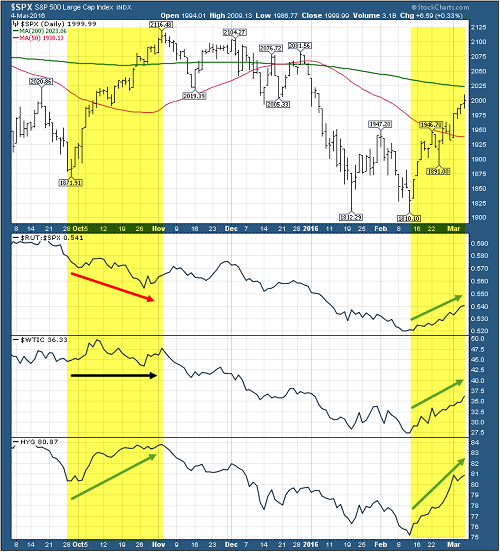
Junk Bonds just became much too attractive for investors. Now the trucks are backing up…
Investors piled into US junk bond funds at the fastest pace on record as a relief rally in global equity and fixed income markets coaxed fresh money off the sidelines.
US funds invested in high yield debt counted $5bn of inflows in the week to March 2, the greatest seven-day haul since record keeping began in 1992, according to fund flows tracked by Lipper.
The moves highlight an easing of investor anxiety after a string of better than expected economic reports in the US, a stabilisation in crude prices and the view that central banks in Europe, Japan and China are prepared to provide further economic stimulus if needed.
…and the world’s big Bond manager is supplying many of the semi trailers…
Pacific Investment Management Co. says it’s time to buy U.S. junk bonds. And the money manager is not alone.
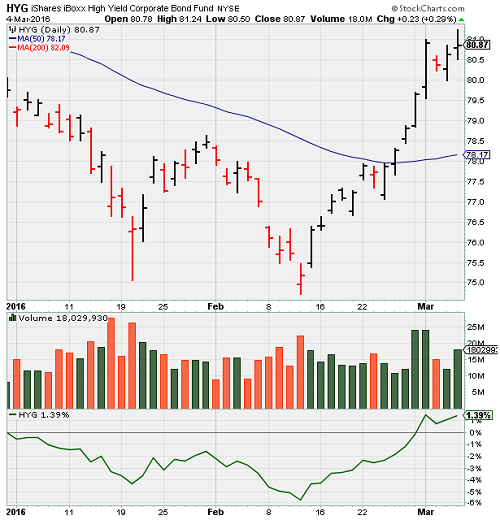
Investors have sunk record levels of cash into the largest high-yield-debt exchange-traded fund in recent days. Prices for the bonds have been rising since mid-February…
Consumer spending is still strong, and corporate profits are still solid, said Mark Kiesel, chief investment officer for global credit at Pimco in Newport Beach, California. Those factors should fuel strong returns for junk bonds, he said, adding that he thinks the economy is doing well.
“The market is as attractive as it’s been in four or five years,” Kiesel said. “There are a lot of opportunities there.” Pimco has started buying debt in the energy sector for the first time in several years, he added, after the price of oil rose in recent weeks.
The market’s appetite for Junk Bonds can be easily seen here…
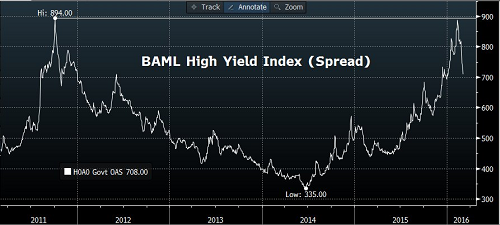
(@MktOutperform)
You can also see the move in the Junk Bond ETFs (NYSE:HYG)…
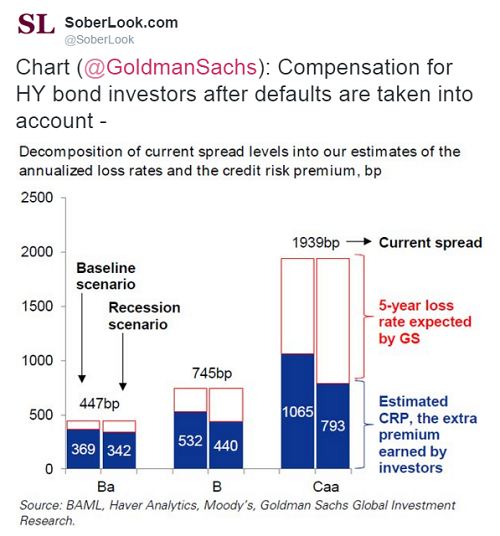
A good Goldman Sachs (NYSE:GS) chart showing that High Yield became too cheap for even a recession scenario analysis…
And so as Junk Bonds and Commodities bounced back, so did any Equities involved either. Just look at the size of these weekly moves…
The following are this week’s top 20 percentage gainers, categorized by sectors (over $300 mln market cap and 100K average daily volume)…
Materials: VALE (4.38 +61.62%), SID (1.97 +58.87%)
Industrials: GOL (8.52 +58.69%)
Consumer Discretionary: FDML (8.17 +64.06%)
Energy: CRC (1.76 +259.18%), SDRL (5.97 +215.87%), UPL (1.1 +214.38%)
DNR (3.26 +173.95%), EPE (3.93 +128.49%), LINE (1 +127.53%)
UNT (10.37 +104.54%), CHK (5.08 +88.15%), SM (15.6 +77.47%)
CJES (1.73 +73%), BTE (3.63 +63.51%), NE (13.17 +60.61%)
LPI (7.86 +58.79%), PBR (5.26 +55.62%), FMSA (3.05 +54.82%)
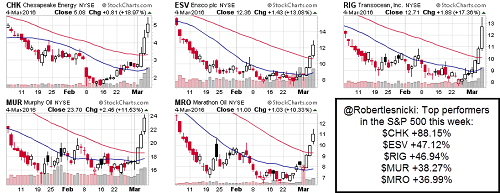
Even the weekly moves in these S&P 500 stocks made for a very good year…
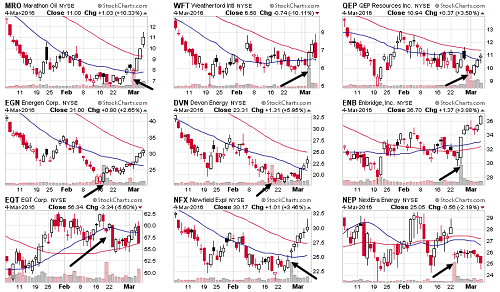
More surprising to the strength in Energy Equities has been the recent raise of nearly $10b in secondary offerings…
The buyers of these discounted deals have done well which will likely lead to even more capital raising among companies recently left for dead. The proceeds can then go to pay down High Yield debt which will only improve those prices which then will again help equity prices so that it becomes a circular inflation in value. (Arrows show the point of secondary offering.)
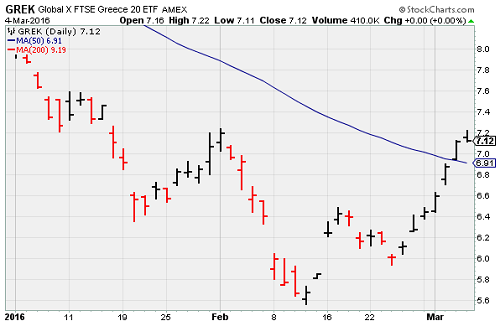
Some might even find it comical that the Greek ETF (NYSE:GREK) has now entered a Bull Market…
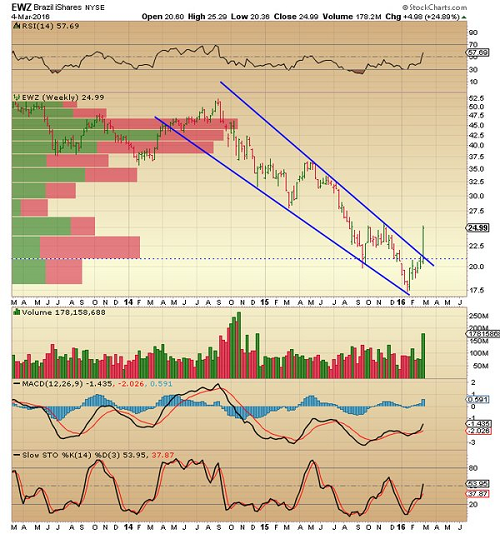
But Greece is small. How about a mega-broken Emerging Market tied to Energy, Metals and Corruption like Brazil…
@DDCapitalFund: Brazil weekly bar and volume speak for themselves on break out of large descending wedge iShares MSCI Brazil Capped (NYSE:EWZ)
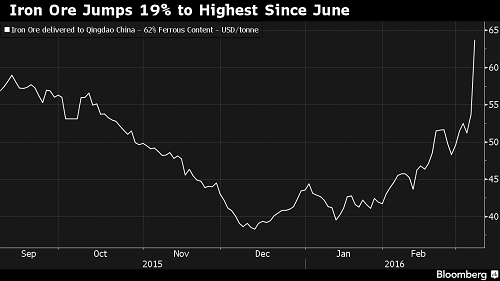
While oil gets all the attention, even commodity metal prices have recovered significantly. Look at this move in Iron Ore…
Iron ore soared the most ever after Chinese policy makers signaled their willingness to buttress economic growth, boosting the outlook for steel consumption in the top user and igniting speculation that some investors who’d bet against the market had been caught out…
Iron ore has powered higher in 2016 as steel prices have strengthened, undermining forecasts for further losses driven by mounting low-cost supply from Australia and Brazil and weakening demand in China. At the annual National People’s Congress at the weekend, the authorities said they’d allow a record high deficit and higher money-supply target to support growth of 6.5 percent to 7 percent. At the same time, they also vowed to help cut overcapacity in steel, potentially curbing demand for iron ore.
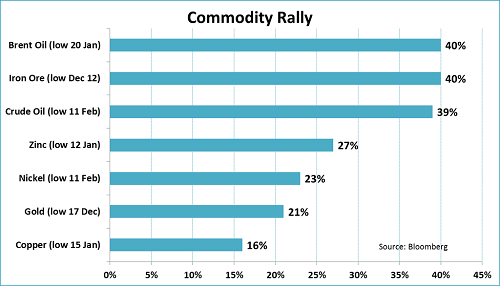
Some Hedge Funds posted big profits on their Commodity driven shorts the last few years. Time to cover and run?
Hedge funds that made big profits betting against mining stocks in 2015 have seen the trade turn sour, as commodity prices have bounced off multiyear lows and triggered a huge rally in the natural resource sector.
Anglo American (LON:AAL) and Glencore (LON:GLEN), the two worst-performing stocks on the FTSE 100 last year, have both had their share prices almost double since the beginning of January, as industrial metal prices have gone on a six-week tear…
Betting against mining stocks last year became a popular way for funds to try to make money out of China’s slowing growth. The world’s second-largest economy has become by far the world’s biggest consumer of industrial metals over the past decade, accounting for about 40 per cent of all copper demand. Anglo American and Glencore were also targeted because of their high debt levels…
“This is deeply scary for the shorts,” said one banker. “The fear of insolvency, which was never a reality, has now receded in Anglo and Glencore and institutions aren’t selling. This could be an almighty problem.”
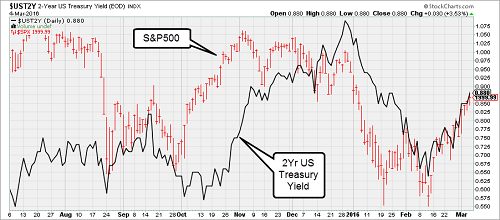
A close look at the S&P 500 shows the tight link with two-year Treasury yields…
As the economy and inflation datapoints strengthen, will the relationship hold? It usually does until inflation and rates get too high. We are far from that today.
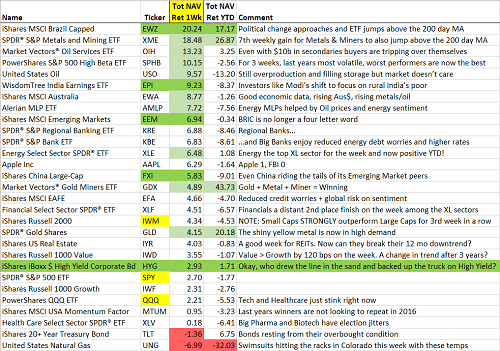
For the week, all sectors posted gains but with a large divergence between Energy and Healthcare…
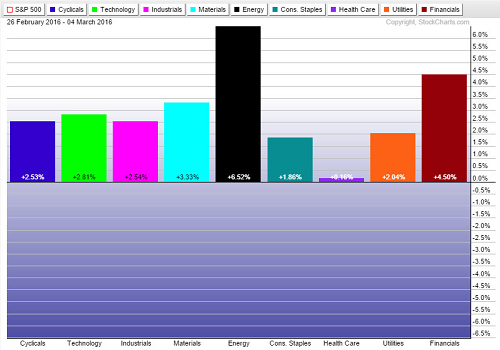
A broader look shows the continued outperformance of 2015’s pariah sectors…
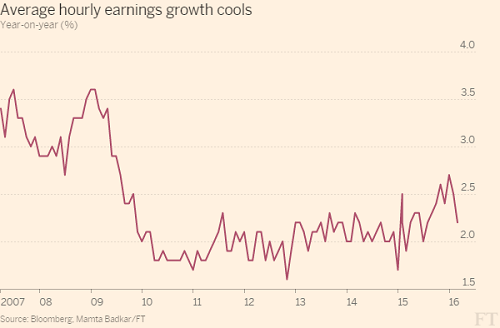
Most discussed chart from Friday’s jobs data. It will be interesting to see if the series adjusts higher next month. Still plenty of evidence of rising wages from individual companies. Even Costco (NASDAQ:COST) had to take up its starting wages last week to fill empty shoes…
Wow…
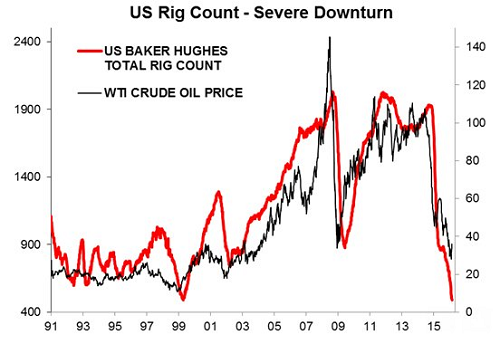
(@Callum_Thomas)
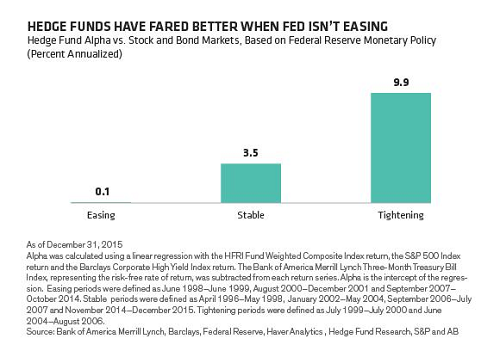
Good analysis by Alliance Bernstein showing which markets Hedge Funds add the most value…
@AB_insights: Hedge fund alpha has faced challenges, but evolving US monetary policy could change that.
Disclaimer: The information presented here is for informational purposes only, and this document is not to be construed as an offer to sell, or the solicitation of an offer to buy, securities. Some investments are not suitable for all investors, and there can be no assurance that any investment strategy will be successful. The hyperlinks included in this message provide direct access to other Internet resources, including Web sites. While we believe this information to be from reliable sources, 361 Capital is not responsible for the accuracy or content of information contained in these sites. Although we make every effort to ensure these links are accurate, up to date and relevant, we cannot take responsibility for pages maintained by external providers. The views expressed by these external providers on their own Web pages or on external sites they link to are not necessarily those of 361 Capital.
