
Omnicom Group Inc. (NYSE:OMC) reported solid fourth-quarter 2018 results wherein the company’s earnings and revenues surpassed the Zacks Consensus Estimate.
Adjusted earnings of $1.77 per share beat the consensus mark by 11 cents and increased on a year-over-year basis.
Total revenues of $4,086.7 million beat the consensus estimate by $10.6 million but decreased 2.2% year over year on a reported basis. The year-over-year decrease was due to negative foreign exchange rate impact of 2% and a decrease in acquisition revenues, net of disposition revenues of 2.4%, partially offset by organic revenue growth of 3.2%.
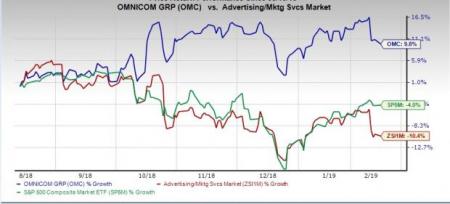
Over the past six months, shares of Omnicom have gained 9.8% against a 4% decline of the Zacks S&P 500 composite and 10.4% decline of the industry it belongs to.
Let’s check out the numbers in detail.
Revenues by Segment
Advertising segment revenues of $2,319.9 million increased 2.3% year over year on a reported basis and 4.4% organically. The segment accounted for 56.8% of total revenues in the reported quarter.
CRM Consumer Experience revenues of $688.1 million declined 3.5% year over year on a reported basis but improved 4.2% organically. The segment contributed 16.8% to total revenues.
CRM Execution & Support revenues of $427.7 million decreased 27.3% year over year on a reported basis and 3.7% organically. It accounted for 10.5% of total revenues.
PR (public relations) revenues of $370.1 million declined 0.7% year over year on a reported basis but improved 1.5% organically. It contributed 9% to total revenues.
Healthcare revenues of $280.9 million were up 19.2% year over year on a reported basis and 7.6% organically. It accounted for 6.9% of total revenues.
Revenues by Regions
Revenues from United States came in at $2,135.2 million, up 0.2% year over year on a reported basis and 2.6% organically. The region accounted for 52.2% of total revenues in the reported quarter.
Revenues from UK came in at $377.2 million, down 0.3% year over year on a reported basis but up 2.4% organically. It accounted for 9.2% of total revenues.
Euro & Other Europe revenues of $770.3 million declined 7.4% year over year on a reported basis but improved 5.7% organically. The region contributed 18.9% to total revenues.
Revenues from Asia Pacific came in at $446.2 million, down 2.7% year over year on a reported basis but increased 2.9% organically. It accounted for 10.9% of total revenues.
Latin American revenues of $131.9 million declined 11.7% year over year on a reported basis but improved 1% organically. It contributed 3.2% to total revenues.
Revenues from the Middle East and Africa were $97.2 million, up 2.5% year over year on a reported basis and 4.2% organically. It accounted for 2.4% of total revenues.
Operating Results
Operating profit in fourth-quarter 2018 increased 0.1% year over year to $627.2 million. Operating margin increased to 15.3% from 15% in the year-ago quarter. Operating expenses of $3,459.5 million were down 2.6% from the year-ago quarter.
Earnings before interest, taxes and amortization or EBITA for the reported quarter were $650 million, slightly down from $653.5 million in the year-ago quarter. EBITA margin came in at 15.9% compared with 15.6% in the year-ago quarter.
Omnicom Group Inc. Price, Consensus and EPS Surprise
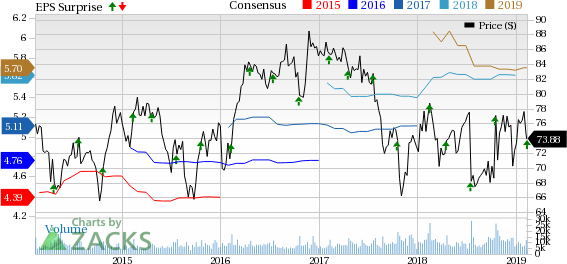
Omnicom Group Inc. Price, Consensus and EPS Surprise | Omnicom Group Inc. Quote
Balance Sheet & Cash Flow
Omnicom generated free cash flow of $1,641.8 million in 2018 compared with $1,675.4 million in 2017. Capital expenditures were $195.7 million.
The company had a total debt of $4,892 million at the end of 2018 with cash, cash equivalents and short-term investments of $3,658 million compared with a respective $4,925 million and $3,796 million in 2017.
For the twelve months ended Dec 31, 2018, return on invested capital (ROIC) and return on equity (ROE) were 29.6% and 51.4%, respectively. During the period from 2009 through Dec 31, 2018, Omnicom distributed 104% of net income to shareholders through dividends and share repurchases.
Zacks Rank & Upcoming Releases
Omnicom currently carries a Zacks Rank #2 (Buy). You can see the complete list of today’s Zacks #1 Rank (Strong Buy) stocks here.
Investors interested in the broader Zacks Business Services sector are keenly awaiting fourth-quarter 2018 earnings reports of key players like IQVIA Holdings (NYSE:IQV) , Waste Management (NYSE:WM) and TransUnion (NYSE:TRU) — all of which are scheduled to report on Feb 14, before market open.
Zacks' Best Stock-Picking Strategy
It's hard to believe, even for us at Zacks. But from 2000-2018, while the market gained +4.8% per year, our top stock-picking strategy averaged +54.3% per year.
How has that screen done lately? From 2017-2018, it sextupled the market's +15.8% gain with a soaring +98.3% return.
Free – See the Stocks It Turned Up for Today >>
TransUnion (TRU): Free Stock Analysis Report
Omnicom Group Inc. (OMC): Free Stock Analysis Report
Waste Management, Inc. (WM): Get Free Report
IQVIA Holdings Inc. (IQV): Free Stock Analysis Report
Original post
Zacks Investment Research