
Noble Energy, Inc. (NASDAQ:NBL) incurred an adjusted loss of 5 cents per share in fourth-quarter 2019, narrower than the Zacks Consensus Estimate of a loss of 9 cents.
Total Revenues
Noble Energy's total revenues were $1,174 million, beating the Zacks Consensus Estimate of $1,098 million by 6.9%. Revenues declined 1.9% from the year-ago quarter’s $1,197 million.
Noble Energy Inc. Price, Consensus and EPS Surprise
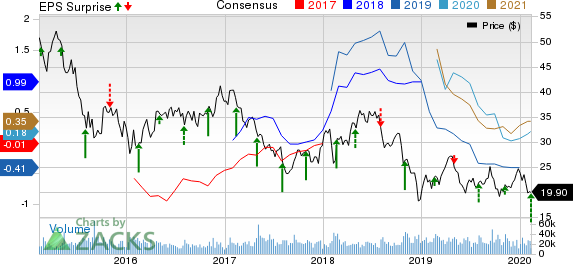
Noble Energy Inc. price-consensus-eps-surprise-chart | Noble Energy Inc. Quote
Highlights of the Release
In the quarter under review, sales volume averaged 373 thousand barrels of oil equivalent per day (MBoe/d), up 6% from the year-ago level. U.S. onshore volumes averaged 285 MBoe/d in the fourth quarter, up 12.6% from the prior-year period. Higher production from the DJ Basin drove U.S. onshore volumes.
Operating expenses in the reported quarter were $2,425 million, up 1.3% from the year-ago period.
Interest expenses in the reported quarter were $64 million, up 3% from the year-ago period.
During the reported quarter, Noble Energy commenced production from the Leviathan field ahead of schedule and more than $200 million under budget.
Realized Prices
U.S. onshore realized crude oil and condensate prices in the reported quarter improved 5.5% to $55.90 per barrel from the year-ago level of $52.98.
U.S. onshore natural gas prices were $1.72 per thousand cubic feet, down 40.1% year over year.
U.S. onshore realized prices for natural gas liquids also declined 41.2% from the year-ago quarter to $14.61 per barrel.
Financial Highlights
Noble Energy's cash and cash equivalents as of Dec 31, 2019 were $484 million compared with $716 million in the corresponding period of 2018.
Long-term debt was $7,477 million as of Dec 31, 2019 compared with $6,574 million in the comparable period of 2018.
Cash flow from operating activities in 2019 was $1,998 million, down from $2,336 million in 2018.
Guidance
Noble Energy expects to invest in the range of $1.6-$1.8 billion in 2020, indicating a decline from $560 million a year ago.
Sales volumes for 2020 are estimated to be 10% higher than 2019, at the midpoint of the company’s guided range of 385-405 MBoe/d. The improvement in volumes can be primarily due to commencement of offshore Israel Leviathan operations at the end of 2019.
Zacks Rank
Currently, Noble Energy carries a Zacks Rank #3 (Hold). You can see the complete list of today’s Zacks #1 Rank (Strong Buy) stocks here.
Other Releases
CNX Resources Corporation (NYSE:CNX) reported fourth-quarter 2019 adjusted earnings of 12 cents per share against the Zacks Consensus Estimate of a loss of 5 cents.
Murphy Oil Corporation (NYSE:MUR) reported fourth-quarter 2019 adjusted earnings of 16 cents per share, which beat the Zacks Consensus Estimate of 12 cents by 33.3%.
Panhandle Oil & Gas (NYSE:PHX) came out with quarterly earnings of 23 cents per share against the Zacks Consensus Estimate of a loss of 1 cent per share.
Today's Best Stocks from Zacks
Would you like to see the updated picks from our best market-beating strategies? From 2017 through 2019, while the S&P 500 gained and impressive +53.6%, five of our strategies returned +65.8%, +97.1%, +118.0%, +175.7% and even +186.7%.
This outperformance has not just been a recent phenomenon. From 2000 – 2019, while the S&P averaged +6.0% per year, our top strategies averaged up to +54.7% per year.
See their latest picks free >>
Noble Energy Inc. (NBL): Free Stock Analysis Report
CNX Resources Corporation. (CNX): Free Stock Analysis Report
Murphy Oil Corporation (MUR): Free Stock Analysis Report
Panhandle Royalty Company (PHX): Free Stock Analysis Report
Original post
Zacks Investment Research