Get 40% Off
💰 Buffett reveals a $6.7B stake in Chubb. Copy the full portfolio for FREE with InvestingPro’s Stock Ideas toolCopy Portfolio

Natural Gas Rally Nearing $2.95 Resistance – May Target $3.75 or higher

Published 08/25/2020, 04:06 PM
Updated 07/09/2023, 06:31 AM
XAU/USD
-
XAG/USD
-
GC
-
SI
-
NG
-
GLD
-
UNG
-

Quietly, as we've been focused on gold, silver and other symbols, natural gas has rallied above the $2.00 level and is starting to break higher again, targeting the $2.95 level. The very deep “rounded bottom” pattern that set up in early 2020 presented a very real opportunity for skilled technical traders by setting up multiple, very deep entry points. We wrote about these setups in a May article when Natural Gas broke $2.00 and again a few weeks ago when NG started its upside breakout move.

The current rally as seen in the chart below appears to be stalling near the $2.50~$2.55 level, which goes all the way back to the Fibonacci Predictive Modelling System trigger levels from April 2020 and October 2020 (see the RED LINES on the chart). We believe any stalling price levels near the $2.55 level will break out to the upside with a further rally attempting to target the $2.95 level. After that level is reached, there is a potential that a further upside price move may take place, but we would urge skilled traders to consider the $2.85 to $2.95 level as the “pull profit” level. Any further leg higher may, or may not, actually happen.Natural Gas Futures Weekly Chart.
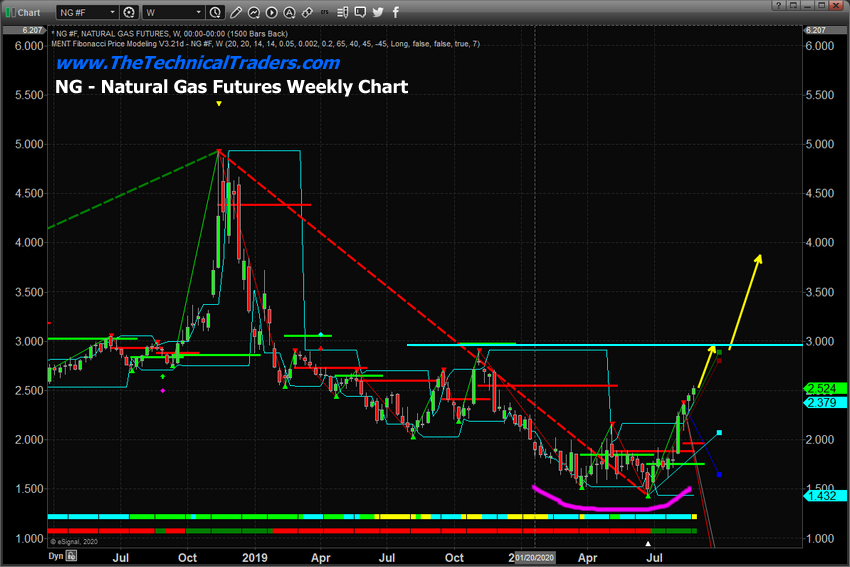
This move from the low $1.50 to $1.65 level in natural gas has resulted in a tremendous 70% upside price rally. Another $0.50 rally from current levels would represent a nearly 95% to 100% upside price rally from the ultimate lows near $1.43.

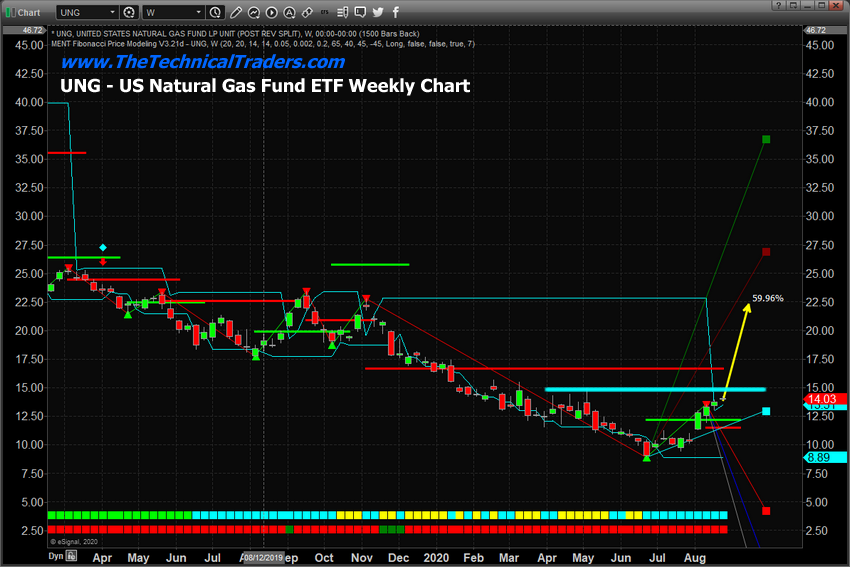
This last breakout rally may represent a solid 35% to 55% upside price opportunity for skilled technical traders in the United States Natural Gas Fund (NYSE:UNG). When looking at the UNG chart below, we believe that once UNG crosses the $15.00 price level, it will quickly attempt to target the $20 to $22 level if NG rallies to levels near $3.00. It should also be noted UNG has not rallied at a similar percentage price level to NG during this bottom/rally. As such, a breakout move in NG could prompt UNG to rally 70% or more – possibly targeting $22 or higher.
3rd party Ad. Not an offer or recommendation by Investing.com. See disclosure here or remove ads .

U.S. Natural Gas Fund ETF Weekly Chart.

Latest comments

Itll pull back to 2.0 before going higher...
yeah 3380 in storage nat gas is super bearish and you are a paid pumper writer only thing keeping these PRICES up is hurricane news which is overblown
agreed with the article author. main reason behind this rally is the production decline. now NG production is at 89.3bcf/d but last year at this same time was at 93bcf/d. last year November was at 96bcf/d. this is a huge difference. based on EIA STEO report, NG production will be declined to 82bcf/d in April 2021. NG fundamentals are changed even this winter has the same temperature as last year.
Bought it at 1.5, sold half n holding to the rest. I dont think it will under 1.5 because producers cant make any money at 1.5.
Pure gambling!
My feeling: ready to crash big soon.
well, time to sell , you guys never get it right
Oh well thats why we still on this forum
Well, actually by chance I realized this opportunity a month ago and I went long with ETF, and I am with nice profits so far. But, I surely won't recall the position at this point, I think there is much further to go.  Then, @jack if you think you are good predicting what Jerome Powell has in his mind, well, I would love to read your Articles here. You can understand that this situation in markets is rather unconventional and all the big investors (Warren Buffet, Jeremy Grantham, Jim Rogers) preferred to stay cautious on this rally, probably you will understand Markets much more than them I assume.
Risk Disclosure: Trading in financial instruments and/or cryptocurrencies involves high risks including the risk of losing some, or all, of your investment amount, and may not be suitable for all investors. Prices of cryptocurrencies are extremely volatile and may be affected by external factors such as financial, regulatory or political events. Trading on margin increases the financial risks.
Before deciding to trade in financial instrument or cryptocurrencies you should be fully informed of the risks and costs associated with trading the financial markets, carefully consider your investment objectives, level of experience, and risk appetite, and seek professional advice where needed.
Fusion Media would like to remind you that the data contained in this website is not necessarily real-time nor accurate. The data and prices on the website are not necessarily provided by any market or exchange, but may be provided by market makers, and so prices may not be accurate and may differ from the actual price at any given market, meaning prices are indicative and not appropriate for trading purposes. Fusion Media and any provider of the data contained in this website will not accept liability for any loss or damage as a result of your trading, or your reliance on the information contained within this website.
It is prohibited to use, store, reproduce, display, modify, transmit or distribute the data contained in this website without the explicit prior written permission of Fusion Media and/or the data provider. All intellectual property rights are reserved by the providers and/or the exchange providing the data contained in this website.
Fusion Media may be compensated by the advertisers that appear on the website, based on your interaction with the advertisements or advertisers.
© 2007-2024 - Fusion Media Limited. All Rights Reserved.