Further to my last weekly market update, this week's update will look at:
- 6 Major Indices
- 9 Major Sectors
- Ratio Charts comparing the SPX to other Major World Indices
As shown on the Weekly charts and 1-Week percentage gained/lost graph below of the Major Indices, all but one closed higher on the week than the prior week. Rather than the Dow Transports Index leading on this week's gains (as it has in the past few weeks), it was the one that lost a minor amount. The Nasdaq 100 gained the most, and the Russell 2000 gained the least.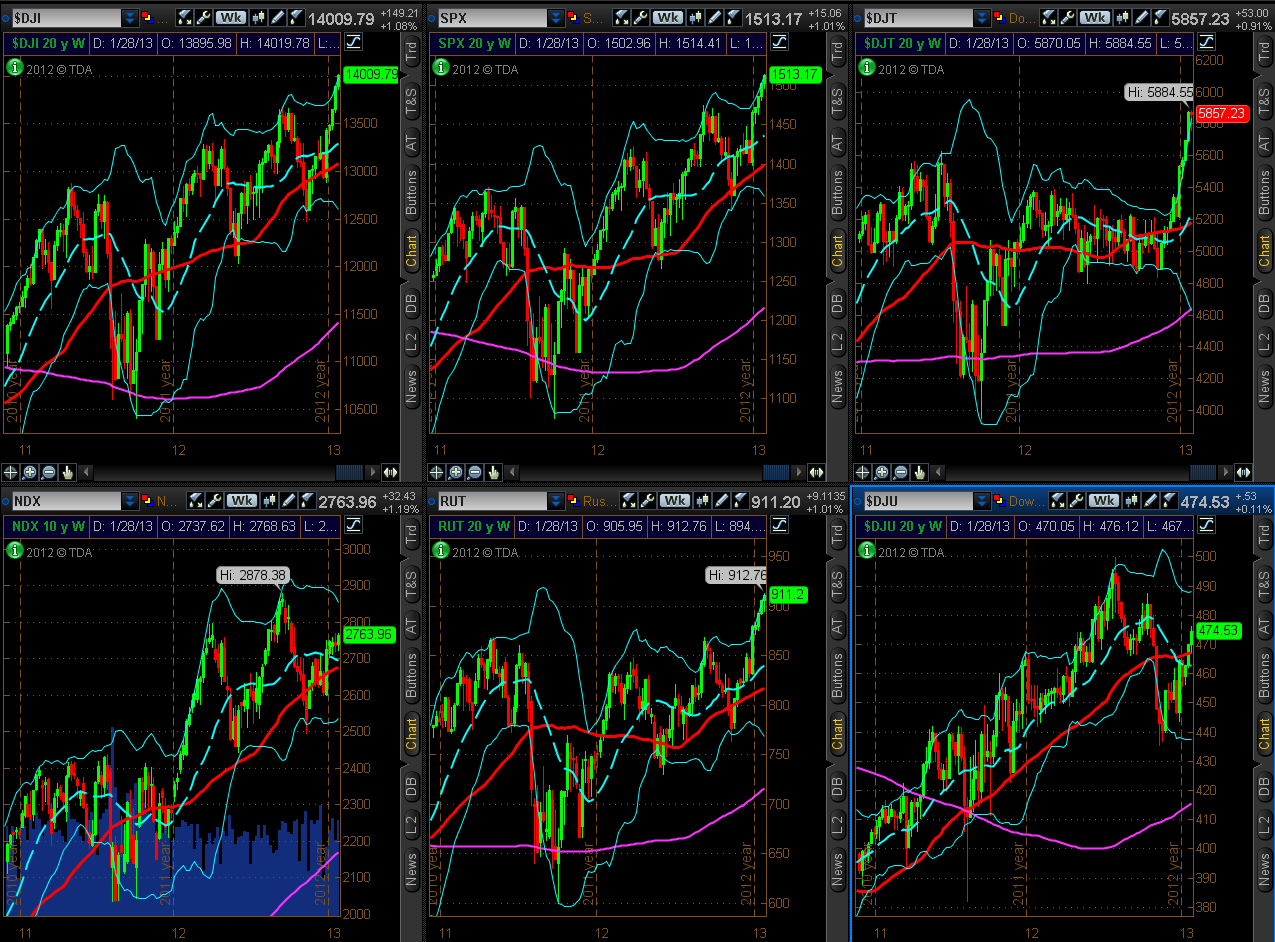
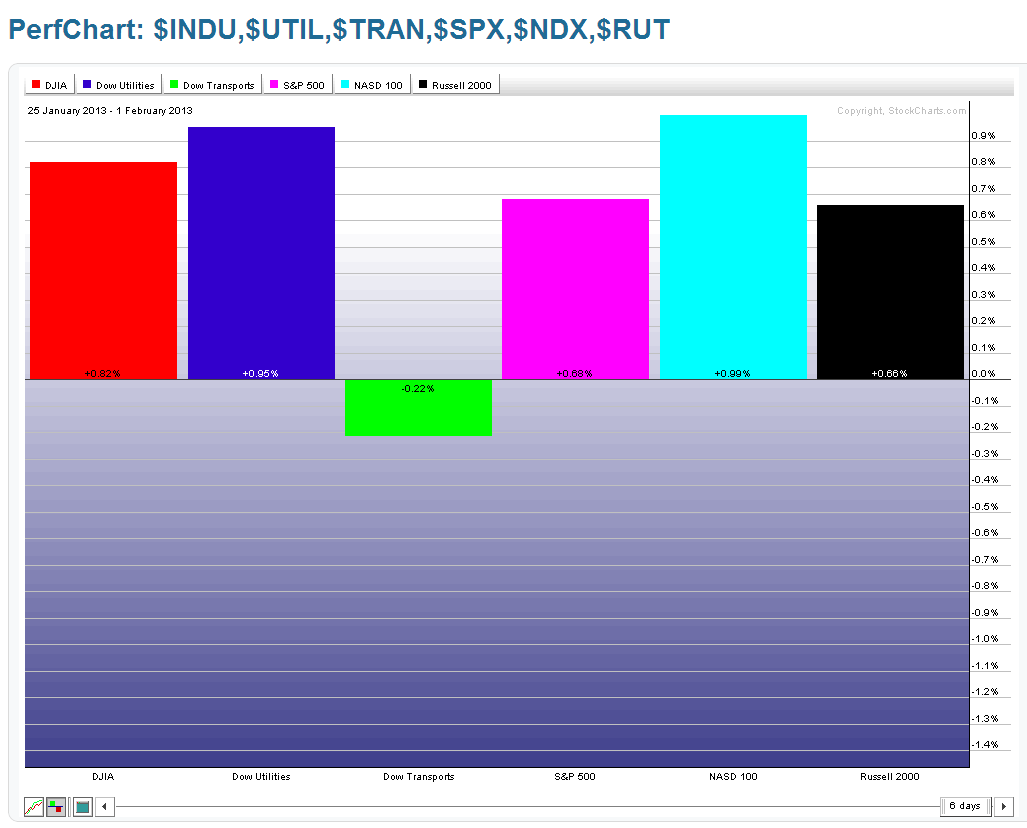
In my earlier post today (Friday), I mentioned the Dow 30 reaching 14000 for the first time since October 2007, when it reached its all-time high of 14198.10. It closed above 14000 today, and the current uptrend on the Daily timeframe on the INDU, SPX, NDX & RUT remains intact. As an aside, the SPX also closed above 1500 and the RUT closed above 900 (both important "century numbers") for a second consecutive week. We'll see whether these levels hold as support in the near-term for these 3 Major Indices.
The Weekly charts below of their corresponding 4 E-mini Futures Indices shows that volumes picked up very slightly on this week's advance...something to watch to see if higher volumes continue to flow into equities now that the 14000 level has been broken. Inasmuch as the upper Bollinger Band is being pushed higher on Big-caps, Small-caps, and Transports, we may see some kind of pause (or even minor pullback) on those while Technology and Utilities play catch-up...however, I'm not seeing excessive/frothy volumes to suggest that, so we may see continued steady upward momentum in all Indices as we move closer to the next equity Options Expiration period on February 15th.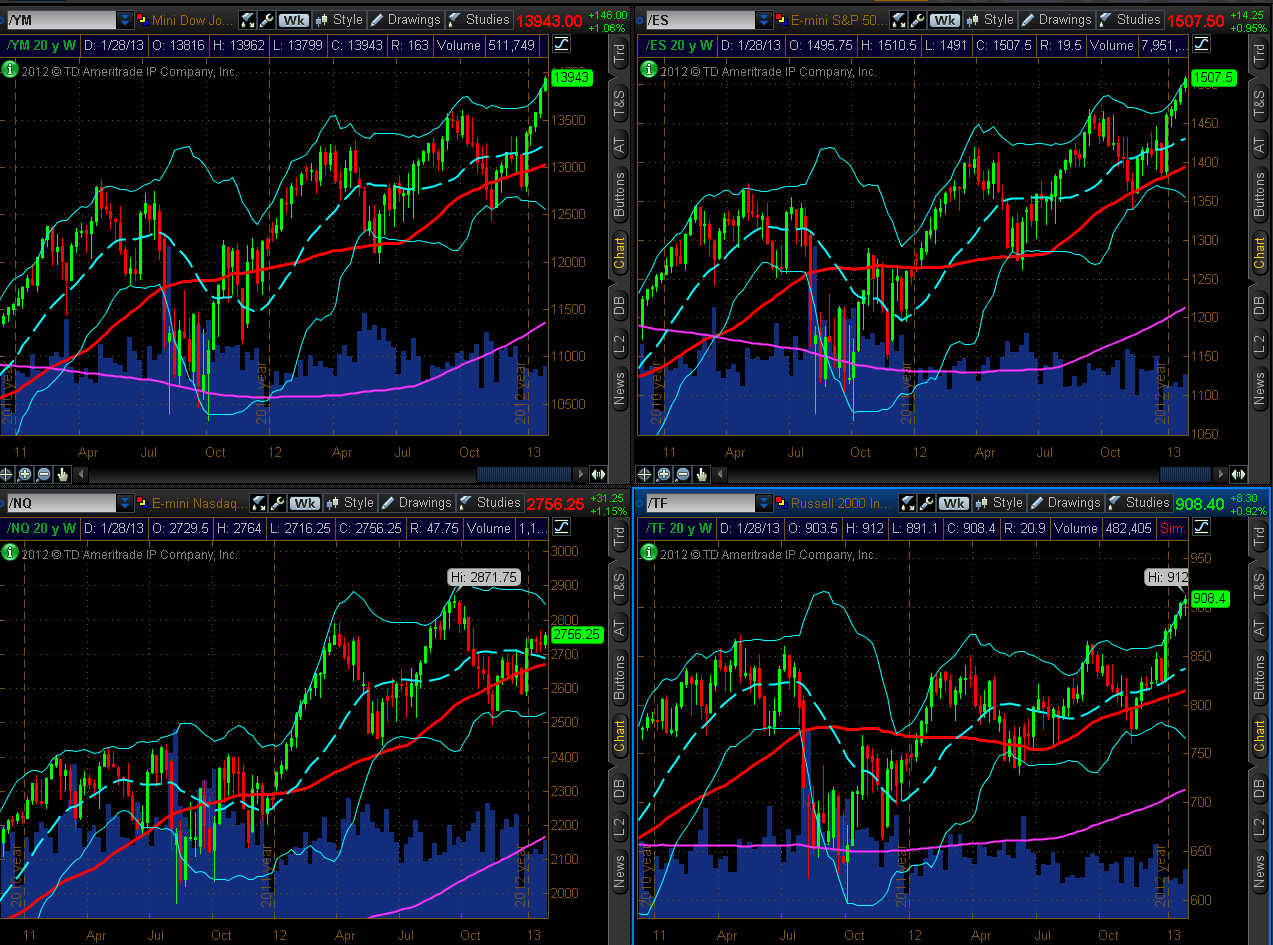
9 Major Sectors
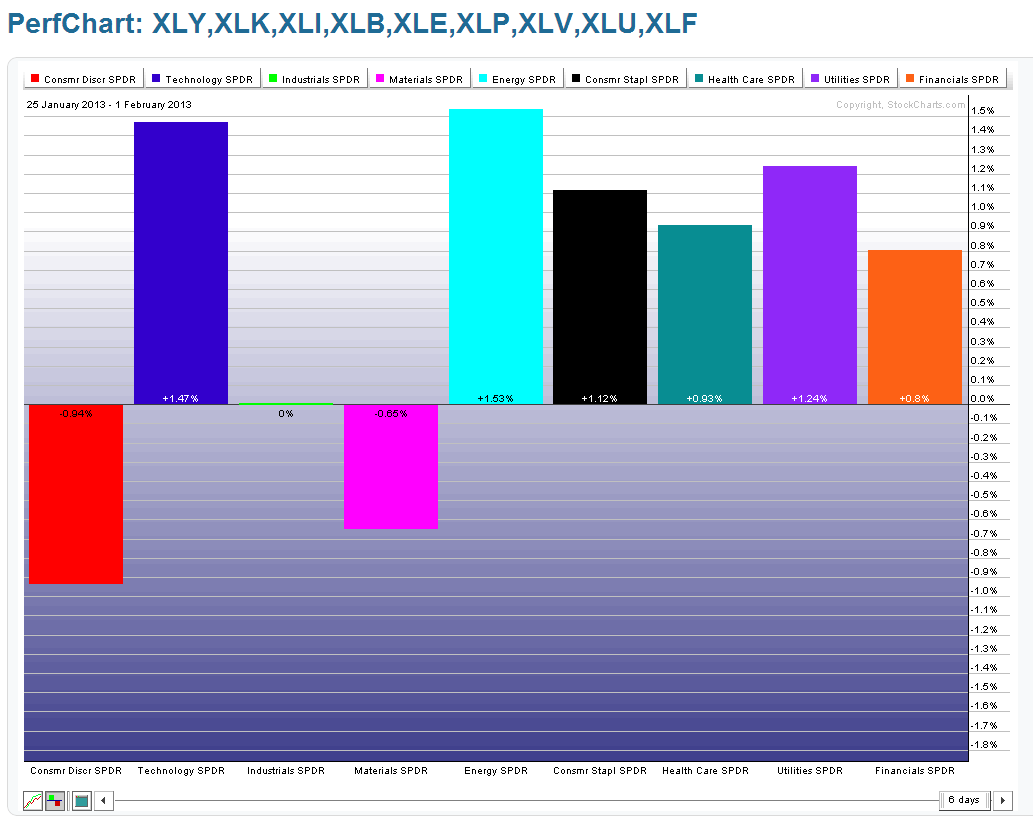
As shown on the Weekly charts and 1-Week percentage gained/lost graph below of the Major Sectors, the largest gains this past week were in Energy and Technology, while Consumer Discretionary and Materials lost the most. Inasmuch as new life-time highs were reached the prior week in Consumer Discretionary, it's understandable that some profits were taken this week. As with their respective Indices noted above, the Technology and Utilities Sectors have yet to reach their upper Weekly Bollinger Bands, so we may see more of an interest generated in these Sectors in the coming week(s).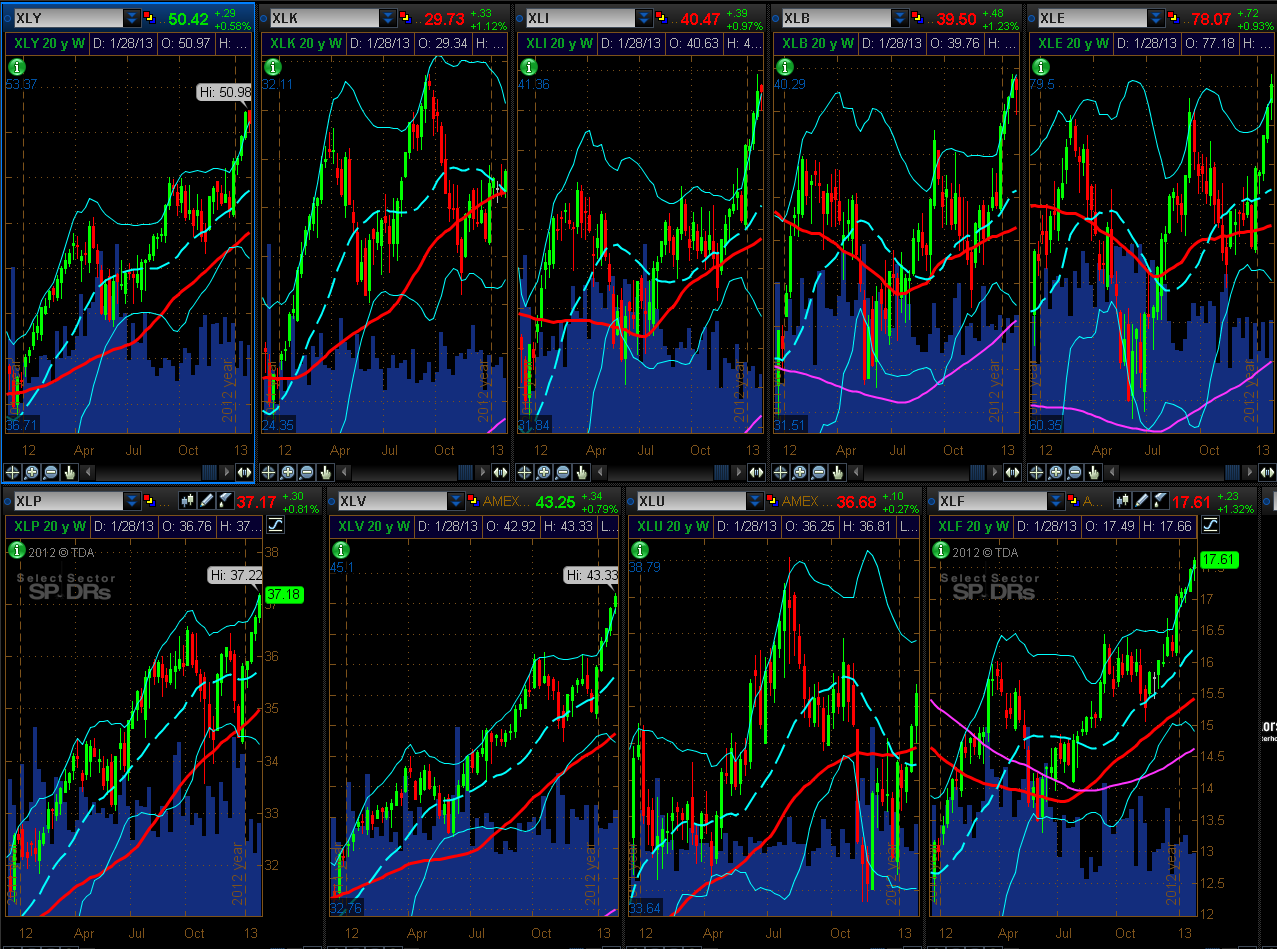
Ratio Charts comparing the SPX to other Major World Indices
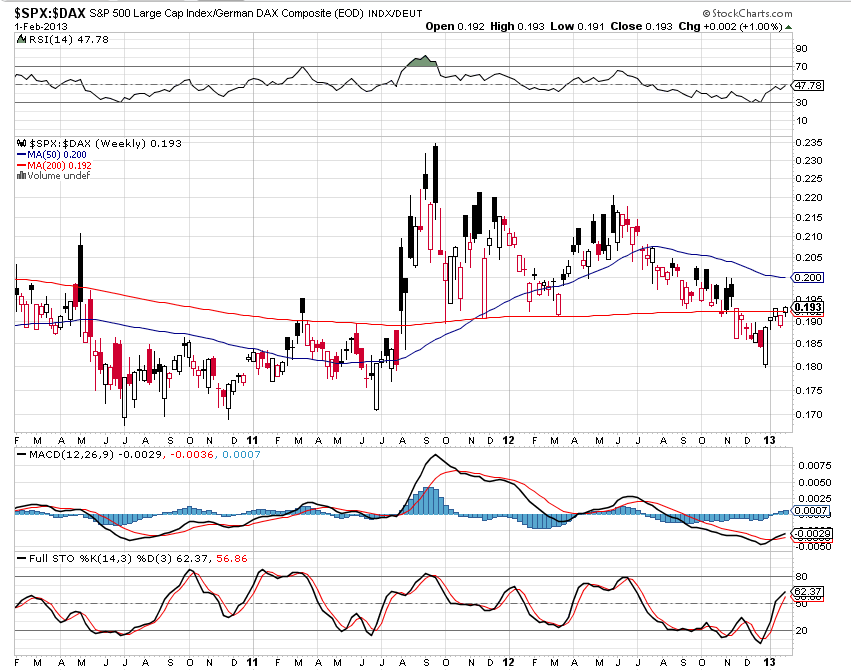
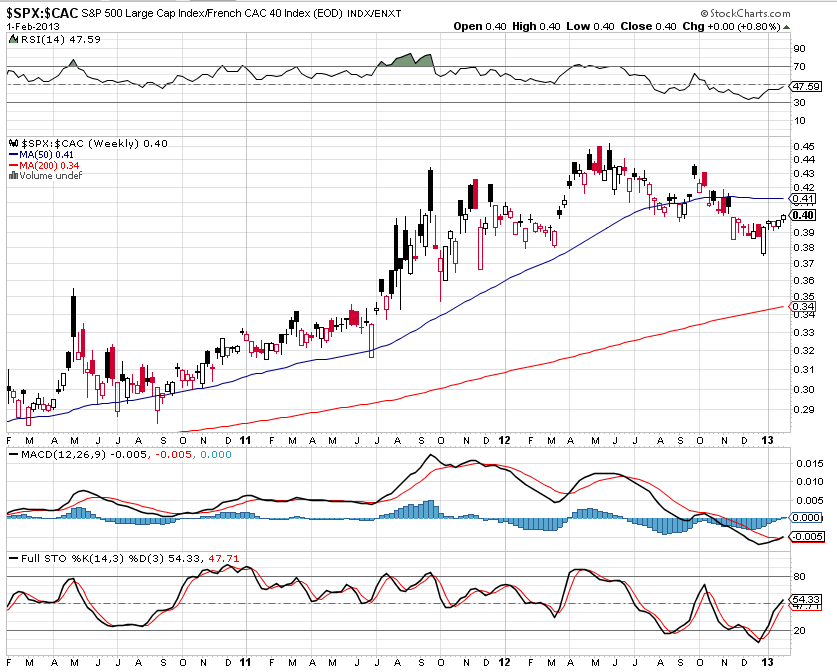
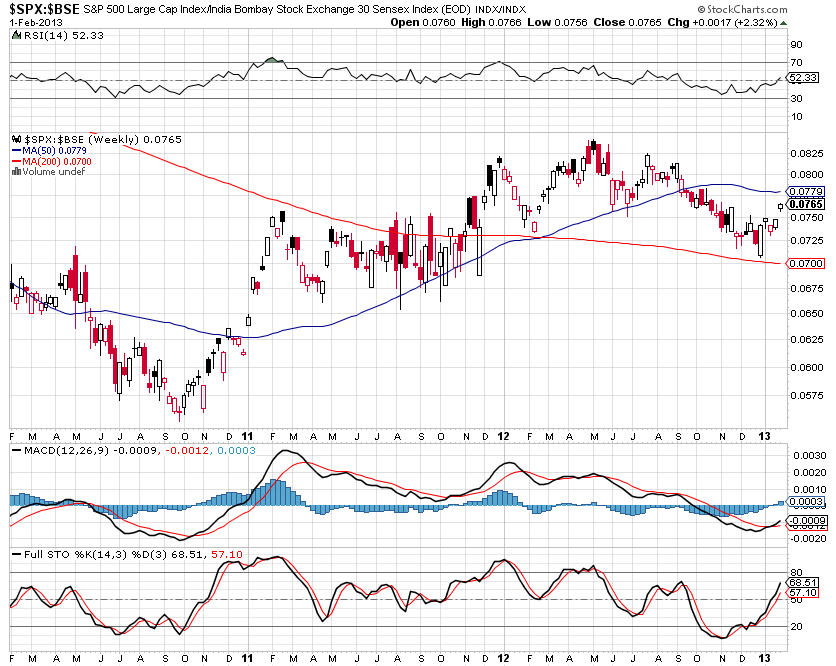
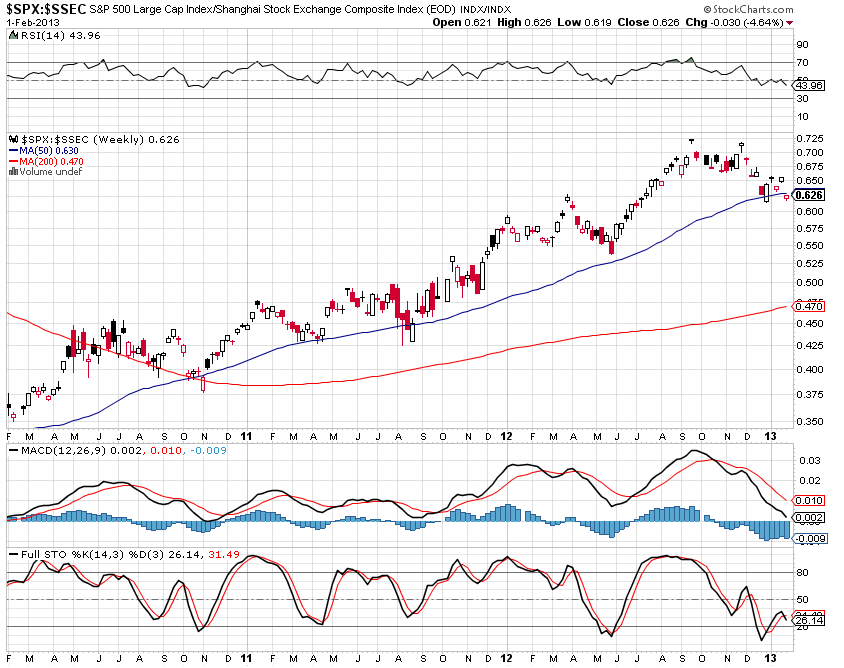
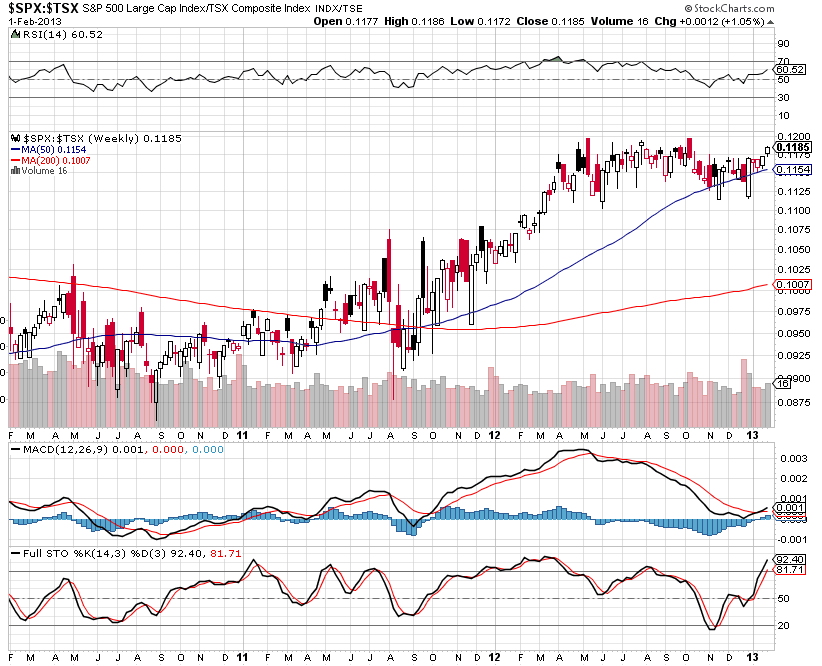
I last wrote about these in my post of January 11th. As I mentioned, the SPX began to bounce in early January after generally trending down from mid-2012, as compared with their Major World Index counterparts. The following Weekly ratio charts show that the SPX has continued to outpace some of the others, while remaining neutral against the World Index, Britain, Russia, and Australia, and declining against China and Japan. These are worth monitoring over the coming weeks to see if the current momentum continues and to see whether the U.S. is, in fact, the "best place to invest for 2013," as some analysts/fund managers have been claiming. 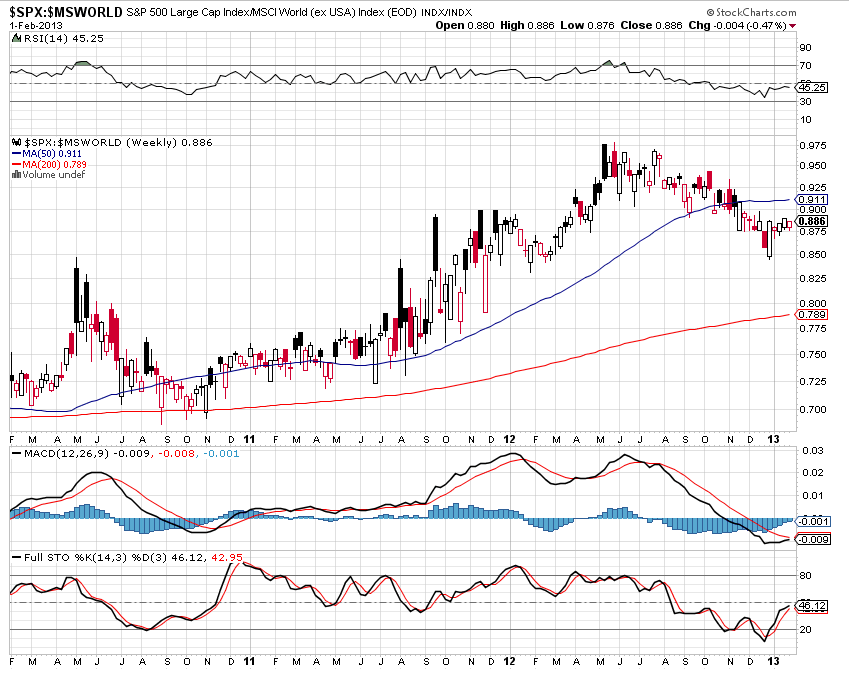
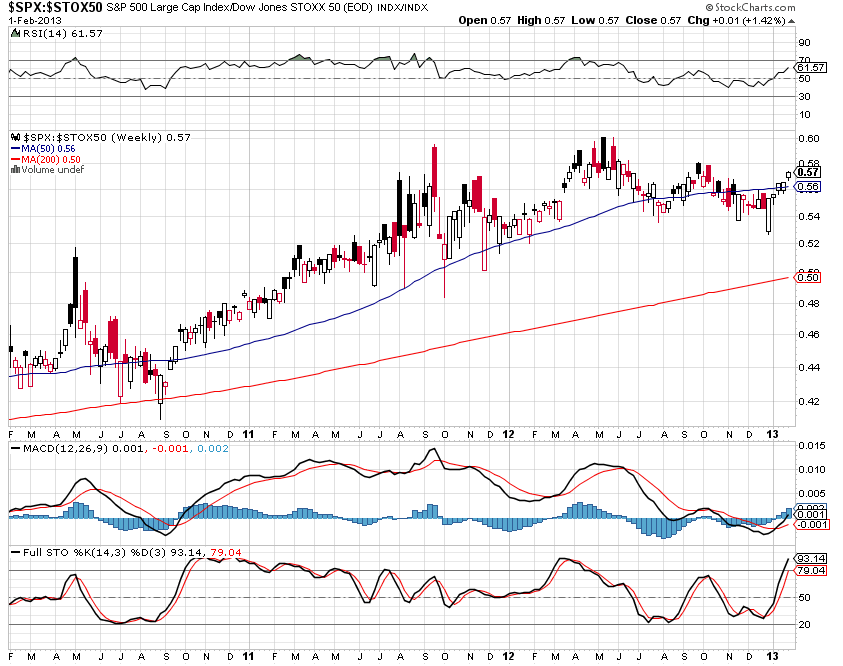
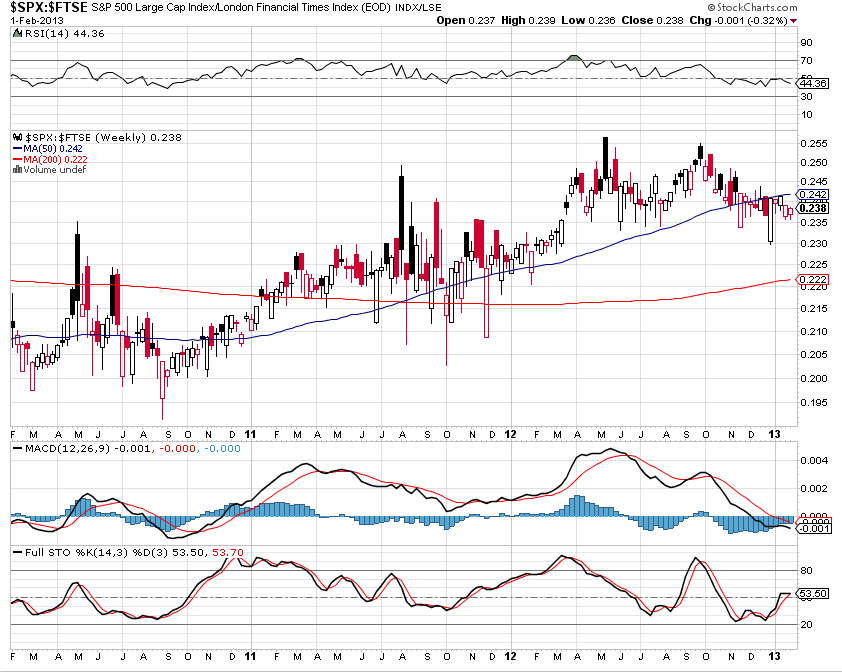
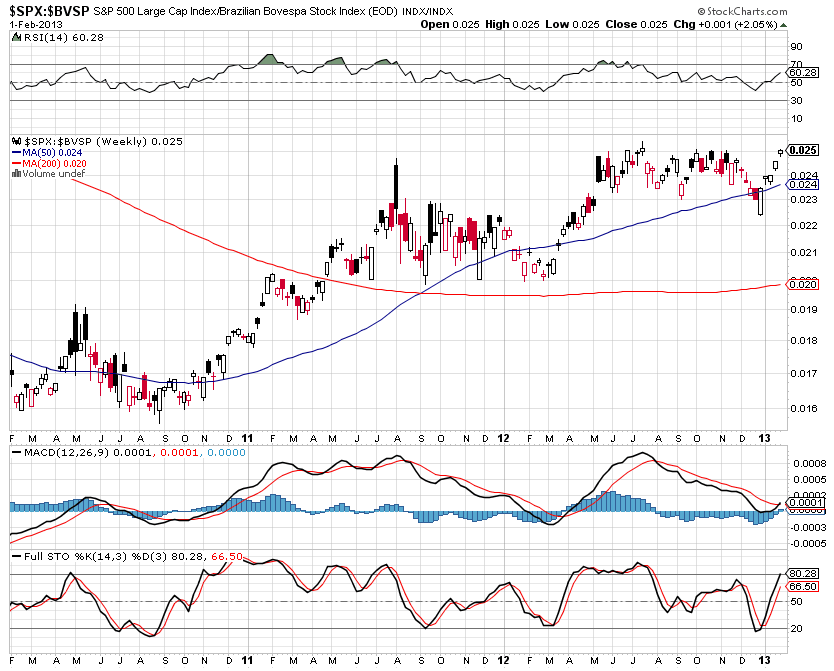
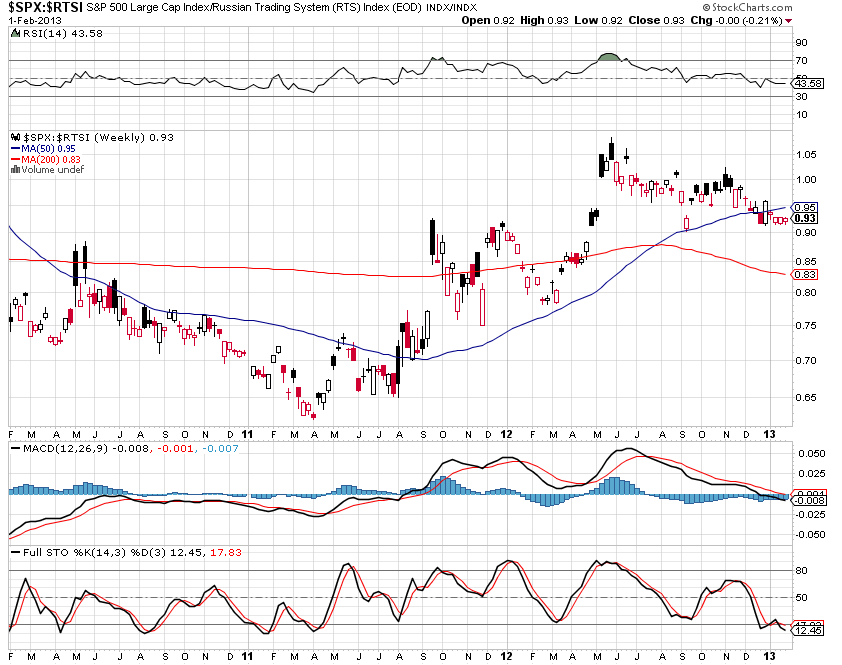
Summary
In summary, I'll basically repeat what I said last week -- "We may see a general advance in equities for some time this year, punctuated by pullbacks, as buyers rotate into and out of various Sectors/Indices to relieve overbought scenarios and (for those that haven't already) to, perhaps reach new all-time highs." This is supported by the Fed's re-affirmation (at its last meeting on January 30th) to "continue its purchase of Treasury and agency mortgage-backed securities, and employ its other policy tools as appropriate."
We'll see if price holds above the 14000 level on the Dow 30, the 1500 level on the S&P 500, and the 900 level on the Russell 2000 Indices. Increasing volumes (without being excessive or frothy) on further (orderly) advances above those levels should indicate that more money is now flowing into equities to support a sustainable rally from here...I'd become concerned if we suddenly see parabolic upside moves on high volumes, which, to me, could indicate that a pullback is near.
