
Mid-America Apartment Communities, Inc. (NYSE:MAA) , commonly referred as MAA, reported fourth-quarter 2017 funds from operations (FFO) of $1.50 per share, beating the Zacks Consensus Estimate of $1.48. The figure also compared favorably with the prior-year quarter tally of $1.13.
This residential REIT’s quarterly results reflected growth in same-store property net operating income (NOI) and rise in average effective rent per unit for the same-store portfolio.
Rental and other property revenues came in at $382.7 million in the fourth quarter, higher than the prior-year quarter tally by 24.6%. However, the figure missed the Zacks Consensus estimate of $386.3 million.
For full-year 2017, FFO per share came in at $5.94, up 6.3% from the prior-year tally of $5.59. This was backed by 35.9% year-over-year growth in rental and other property revenues to $1.5 billion.
Quarter in Detail
During the reported quarter, combined adjusted same-store NOI increased 2.2% compared with the prior-year quarter. This reflected 1.8% growth in revenues and 1.3% rise in operating expenses.
In the large market, 1.6% growth in revenues and a 1.3% increase in expenses resulted in the company’s NOI to be up 1.7%. Again, in the secondary market, a 2.6% rise in revenues and 1.1% increase in expenses led to 3.6% growth in NOI.
The quarter witnessed 1.7% year-over-year increase in average effective rent per unit. Further, during the quarter, average physical occupancy for the same-store portfolio was 96.2%, reflecting an expansion of 20 basis points from the year-earlier quarter.
As of Dec 31, 2017, MAA held cash and cash equivalents of nearly $10.8 million, down from $33.5 million as of Dec 31, 2016. Furthermore, as of the same date, around $598.3 million of combined cash and capacity was available under its unsecured revolving credit facility.
The Post Properties Merger
During fourth-quarter 2017, MAA incurred a total of 5 cents per share of merger and integration costs. For full-year 2017, the company incurred 17 cents per share of merger and integration costs. Notably, it expects full consolidation of MAA and Post Properties to be accomplished later this year. Additionally, MAA continues to project expected synergies of around $20.0 million in gross overhead costs to be realized from the merger.
Portfolio Activity
During fourth-quarter 2017, MAA purchased a newly developed 320-unit apartment community — Acklen West End — in the Downtown/West End submarket of Nashville, TN, for $71.8 million. On the other hand, the company sold two properties in the Atlanta, GA, market for aggregate proceeds of $97.4 million.
At the end of the fourth quarter, MAA had three multi-family projects under development (937 units), with total projected cost of $214.0 million. Notably, an estimated $46.3 million remained to be funded as of Dec 31, 2017.
Outlook
MAA projects 2018 FFO per share in the range of $5.85-$6.15. Currently, the Zacks Consensus Estimate for the 2018 FFO per share is $6.15. For first-quarter 2018, the FFO per share is anticipated in the band of $1.38-$1.48. At present, the Zacks Consensus Estimate for the first-quarter FFO per share is $1.50.
Our Viewpoint
MAA remains well poised for long-term growth, backed by its well-balanced portfolio, which is diversified in terms of markets, submarkets and price points, and is located in the growing Southeast and Southwest regions of the United States. Also, integration of the MAA and Post Properties is on track and is anticipated to significant scale and capabilities. Nevertheless, rising supply of new units in a number of markets is likely to put pressure on rental rates and adversely affect revenue growth in the near term.
MAA has a Zacks Rank #3 (Hold). You can see the complete list of today’s Zacks #1 Rank (Strong Buy) stocks here.
In the past month, shares of MAA have declined 5.2%, underperforming the 4.6% loss incurred by its industry.
Mid-America Apartment Communities, Inc. Price, Consensus and EPS Surprise
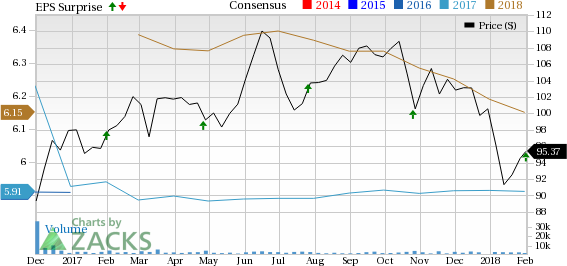
Mid-America Apartment Communities, Inc. Price, Consensus and EPS Surprise | Mid-America Apartment Communities, Inc. Quote
We now look forward to the earnings releases of other REITs like UDR Inc. (NYSE:UDR) , Essex Property Trust Inc. (NYSE:ESS) and Regency Centers Corporation (NYSE:REG) . UDR Inc. and Essex Property are scheduled to release results on Feb 6 and 7, while Regency Centers is slated to report its numbers on Feb 8.
Note: Anything related to earnings presented in this write-up represent funds from operations (FFO) — a widely used metric to gauge the performance of REITs.
Wall Street’s Next Amazon (NASDAQ:AMZN)
Zacks EVP Kevin Matras believes this familiar stock has only just begun its climb to become one of the greatest investments of all time. It’s a once-in-a-generation opportunity to invest in pure genius.
Click for details >>
Regency Centers Corporation (REG): Free Stock Analysis Report
United Dominion Realty Trust, Inc. (UDR): Free Stock Analysis Report
Mid-America Apartment Communities, Inc. (MAA): Free Stock Analysis Report
Essex Property Trust, Inc. (ESS): Free Stock Analysis Report
Original post
Zacks Investment Research