
Equity markets traded in a risk-on fashion, yesterday, supported by Janet Yellen remarks over the weekend and by the falling coronavirus cases. The market sees the approval of the US stimulus package as a most likely thing, which could keep the positive sentiment for a while more.
Equities Remain Elevated
Yesterday, the equity markets rallied, with some major indices hitting fresh all-time highs. In the US, NASDAQ, Dow and the S&P 500, all hit record highs, while in Europe, DAX also went for a new historic high. However, the German index eventually declined and closed virtually unchanged for the day. The best performing index in Europe was the Italian FTSE MIB, gaining almost one-and-a-half percent. UK’s FTSE 100 also showed a good result, ending the session with around half of a percent gain. The upmove in the UK’s index might have been partially fuelled by the slightly weaker pound.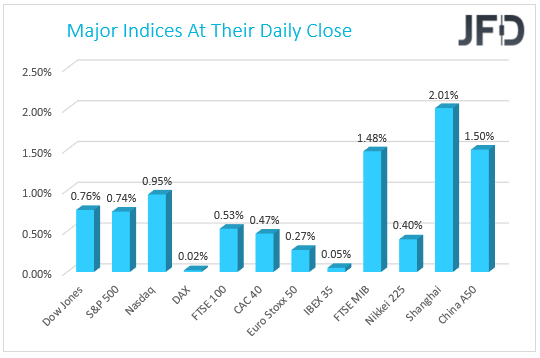
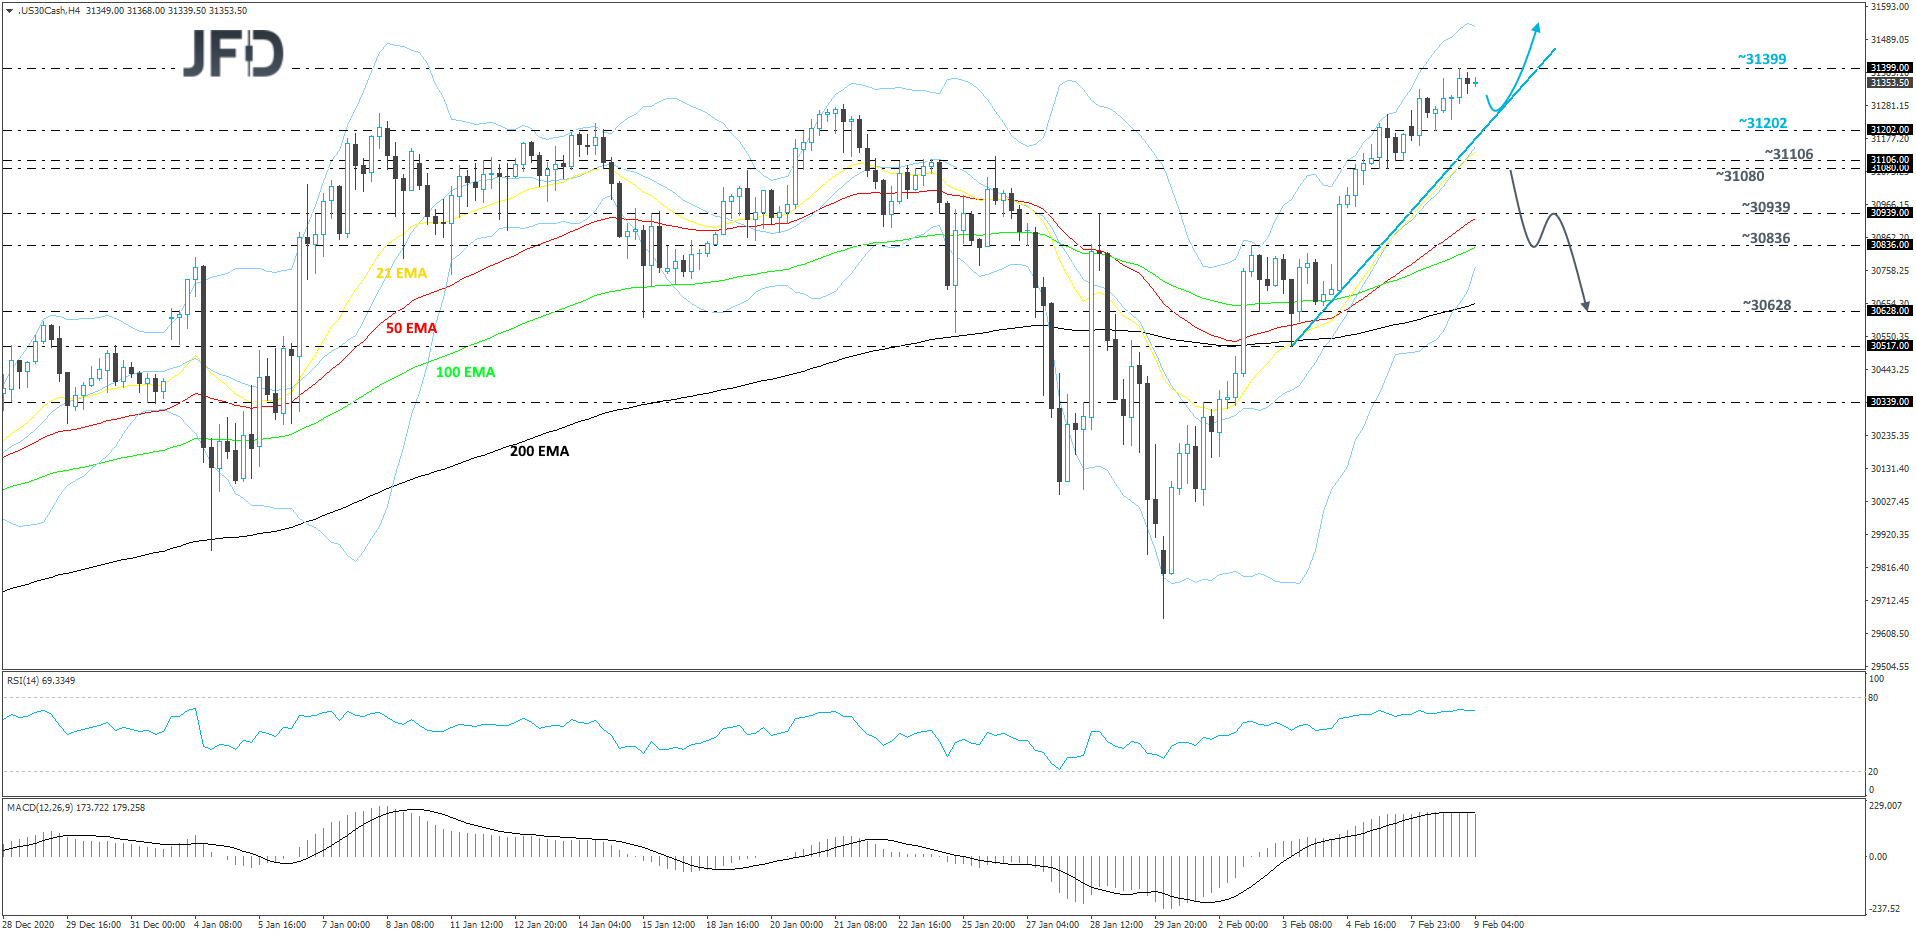
DJIA – Technical Outlook
The DJIA index hit a new all-time high, yesterday, as risk-on environment prevailed. The cash index pushed further north, hitting the area near the 31399 level. The price remains on a steep upmove, while trading above a short-term tentative upside support line taken from the low of Feb. 3. Even if we see a retracement back down and the index stays above that upside line, we will remain positive, at least for now.
A small decline could bring the price back to the 31285 hurdle, marked by the highest point of January, or to the aforementioned upside line, which might provide support again. If so, DJIA could move back up, as more buyers might jump in. We will then aim for the current all-time high, at 31399, a break of which would place the price into the uncharted territory.
Alternatively, if the index breaks the aforementioned upside line and then falls below the 31080 hurdle, marked by an intraday swing low of Feb. 5, that may open the door for further declines. The bulls could get spooked from the field temporarily and the price may slide to the 30939 zone, or to the 30836 area, marked by the high of Feb. 2. If the selling continues, the next possible target might be at 30628, marked by an intraday swing low of Feb. 2.
The positive sentiment could have been stimulated by a few factors. One of which is that, during the weekend, the US Treasury Secretary Janet Yellen made a remark that the US economy could reach full employment next year, if Biden’s $1.9trl stimulus package is approved. Yellen also responded to the criticism surrounding the proposed package, saying that the new stimulus would create more jobs, benefiting millions of households. However, it is believed that the proposed aid bill might trigger inflationary pressures, which could have a severe effect on the US dollar. Although it is one of the main objectives of the Fed to raise inflation to an average of 2% over time, the new stimulus might overcome that target. At least that’s what the former Treasury secretary Larry Summers said, who served during Bill Clinton’s administration. But Janet Yellen seems to be more concerned creating jobs for the people and saving small businesses right now.
In this situation it seems that both sides of the argument are right. Apart from being considered as a support package to the ones that were really hurt by the pandemic, the proposed aid bill is becoming a strong political issue. Those who oppose it, might have not voted for Biden and this could be their way of showing dissatisfaction with the current leadership. But they are forgetting that this way, they might be damaging the lives of those, who are in desperate need of financial support. However, on the other side, those who support the bill, might be too optimistic over the effects that the stimulus package may have on the economy in the longer term. Their support of the bill might be purely to show backing of the current leadership. From the market perspective, investors might take a liking if the new bill gets passed, however, they may revise their strategies if inflation indeed starts rising too quickly.
Yesterday, in the FX world, the two main gainers among the top 8 currencies, were the Australian and New Zealand dollars. With the equity market surging, risk-related AUD and NZD pushed higher against its major counterparts, especially against the safe-haven yen, Swiss franc and US dollar. The latter one was the weakest among the three. If the stock market continues to rally, we might see these commodity-linked currencies, such as AUD and NZD, staying on the stronger side against the safe-havens. For now, the indices are not showing any strong signs of possible reversal to the downside. 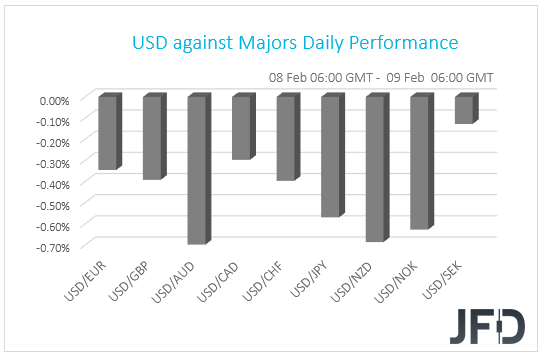
NZD/CAD – Technical Outlook
NZD/CAD continues to move higher, while trading above a couple of short-term tentative upside lines. One is drawn from the low of Jan. 20 and the other one (a slightly steeper one) is taken from the low of Feb. 5. Although the pair is showing signs that it may continue it,s journey north, in order to get comfortable with that idea, we would prefer to wait for a break above the current highest point of February, at 0.9236. Hence our somewhat bullish approach, for now.
A push above the 0.9236 barrier would confirm a forthcoming higher high, potentially inviting more buyers into the game. The pair could then rise to the 0.9257 obstacle, a break of which might clear the path for a move to the 0.9281 level. That level marks the highest point of March 2019.
In order to shift our attention to some lower areas, we would prefer to wait for a break of the aforementioned upside line, drawn from the low of Jan. 20. In addition to that, a rate-drop below the 0.9152 zone, marked by an intraday swing low of Feb. 5, could strengthen the bearish case, potentially opening the door to further declines. NZD/CAD may then travel to the current lowest point of February, at 0.9135, which might stall the slide temporarily. However, if the bears are still felling comfortable, they might push the rate further south, aiming for the 0.9099 level, marked by the low of Jan. 22.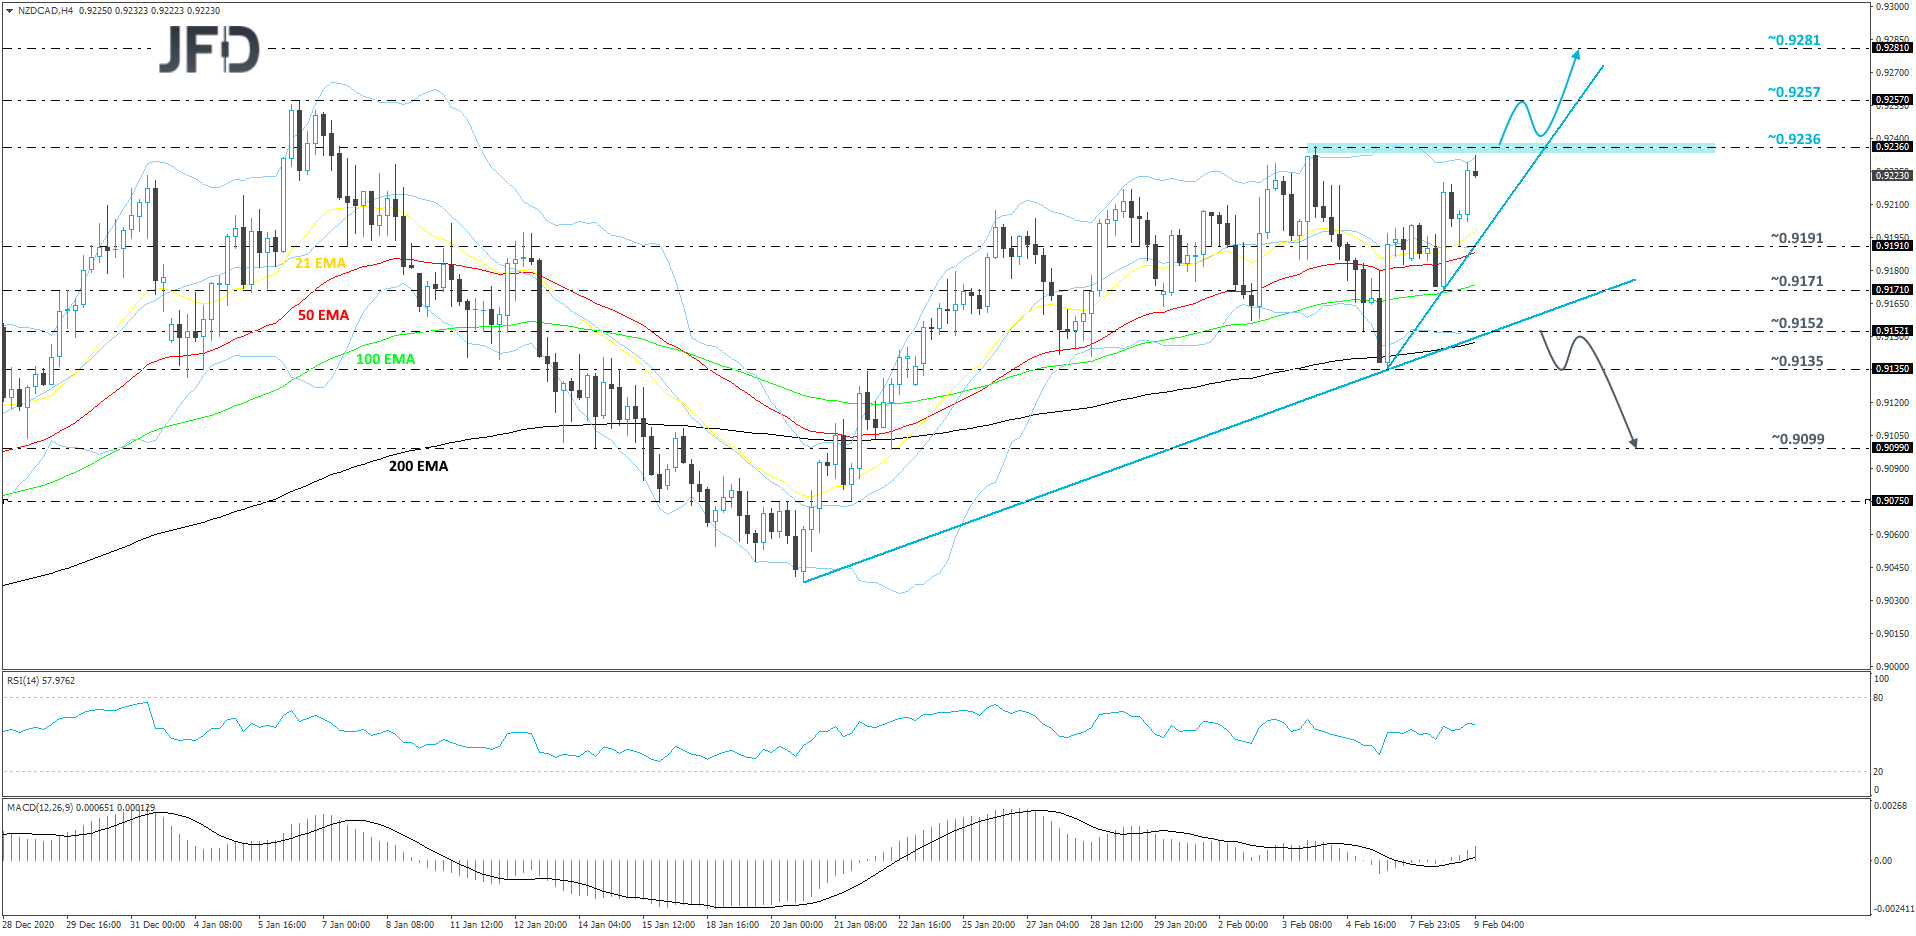
As For The Rest Of Today’s Events
Tuesday is a relatively quiet day in regards to economic indicators. The only worthwhile data set, which we will keep an eye on will be the Energy Information Administration’s (EIA) short-term energy outlook. Every month, EIA delivers its forecast on consumption, supply and prices in relation to oil-related products. Also, from the US, we will get the JOLTs job openings number for the month of December. Currently, the expectation is for the number to decline from 6.527M to 6.400M. If the actual number comes out lower than the forecast, this could be bad for the US dollar. However, we believe that USD may ignore the figure and instead, stay more vulnerable to the broader market sentiment.