: 35%
VIX Status: 19.9%
General (Short-term) Trading Call: Hold.
Commentary
It has been another week since I wrote the last T2108 Update, and another week the market has churned. The S&P 500 ended the week down a little over 1%, clinging to the bottom of critical resistance/support formed by the May, 2011 highs and the index’s last big breakout to new multi-year highs.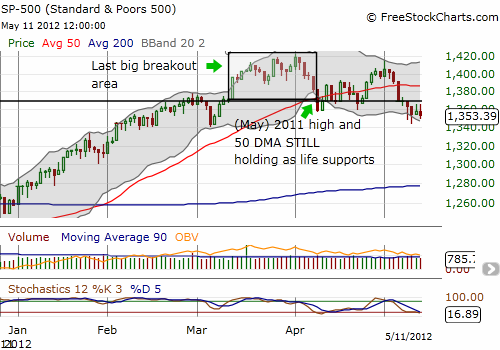
Note that the stochastics in the chart show the S&P 500 is very oversold. In fact, the index is now more oversold stochstically than at any other point this year. Yet, the oversold conditions have also persisted for a week without generating a bounce. I only show this as a reminder that being short the index is a bit hazardous. If T2108 flips oversold in the coming week as I expect, then I will position for a large subsequent bounce. A rally back to the May highs would be consistent with my last “sell-in-May” analysis that determined the best time to sell in May is in the first week of May or at the very end. A subsequent failure to break the May highs or a failed retest of 2012′s high would be consistent with a topping market.
The volatility index, the VIX, is maintaining the suspense by hovering around the critical 21 level. As a reminder, this is the level at which 2011′s summer swoon began.
The Caterpillar (CAT) watch is flashing a bright yellow warning sign as it finally broke below its 200DMA last week. CAT spent the rest of the week churning below this critical technical level. Follow-through to the downside should at a minimum signal (or proceed) a tumble to T2108 oversold. I will interpret the failure of CAT to regain the upperhand over its 200DMA in an oversold bounce as a very bearish signal. 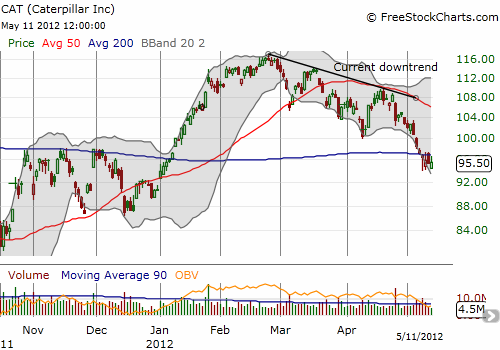
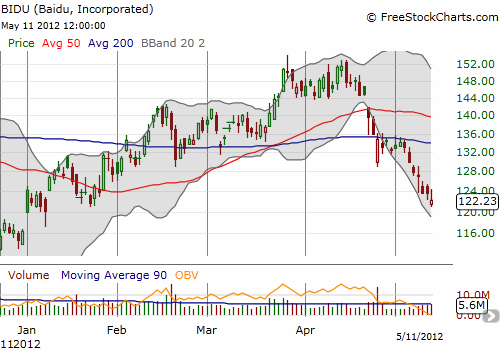
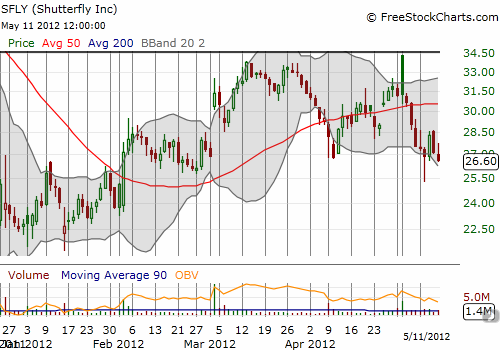
A week ago I posted chart reviews on stocks that all looked very vulnerable: YELP, BIDU, and SFLY. The charts below show that they have all followed-through to the downside.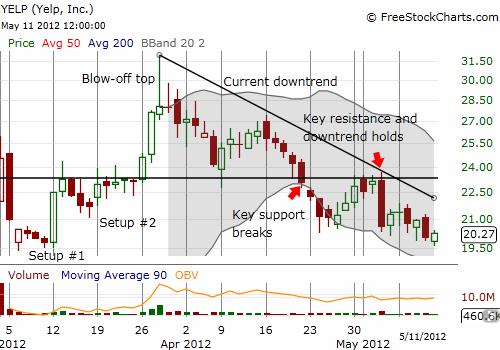
With T2108 in the mid-30s, we know that there are many stocks falling off trend. This is a clear case where the major index hides the real story. The S&P 500 is still just a few percentage points away from fresh multi-year highs yet there appear to be many stocks breaking down. T2107, the percentage of stocks trading above their 200DMAs, continues to flag a longer-term bearish signal. The chart below shows T2107 remains in a downtrend since late 2009. This suggests that slowly but surely, fewer and fewer stocks are participating in the general stock market rally. When this happened during the last bull market, one last rally threw me off the bearish scent. If history repeats itself, we will get another strong rally to break the current T2107 downtrend before things really fall apart. Note carefully that I thought 2011 would be that year. With an election in November, it seems even more likely that a rally could ensue in anticipation of election results (whatever it is the market will consider good versus bad at that time).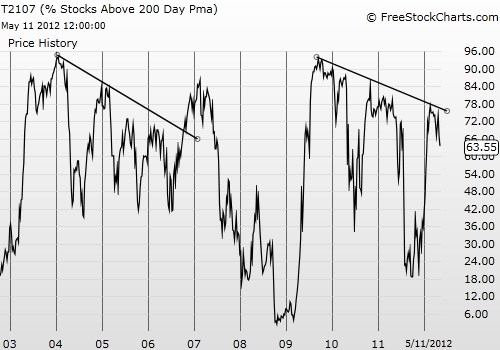
Another key difference with the current T2107 downtrend is that the market has already experienced two major sell-offs. These periods of angst were of deeper relative magnitude (measured by T2107) than what happened before the last bull market ended. It is very possible then that a lot of selling pressure has already been released from the market.
In other words, while T2107 is alarming, it remains too early to make a conclusive statement about its implications. So, I will not again boldly predict the coming of a bear market after a final Fall rally (although last October we got close to a bear market BEFORE a fresh rally!).
The trading call remains a hold because T2108 is still not telling us much here. However, being closer to oversold than to overbought, I have continued to bias my short-term trades to the bullish side. Moreover, I still see in the rearview mirror the massive and historic overbought period that began the year. I have bought SSO calls on dips to sell into the next rally. Last week, I let profits slip and ended up partially salvaging SSO calls that expired last Friday. The last small batch expire this coming Friday. I do not think those are well-positioned if the market hits oversold this week. I am putting a hold on these purchases of SSO calls until T2108 falls oversold. In the meantime, I continue to find unique stock-specific opportunities, both bullish and bearish. I have described these in other posts.
(Note – as of May 11, 2012, some glitch in FreeStockCharts.com is screwing up the overlay of the S&P 500 with T2108).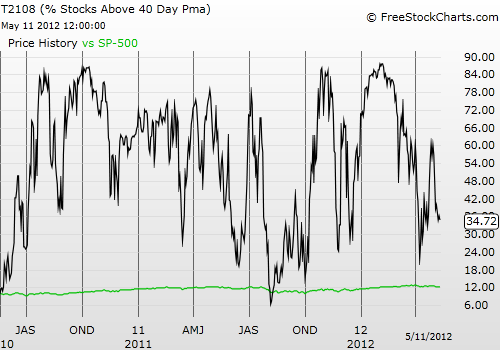
Black line: T2108 (measured on the right); Green line: S&P 500 (for comparative purposes)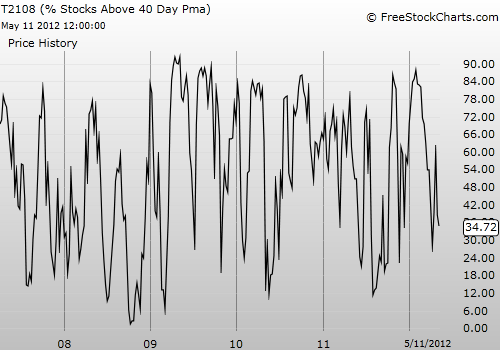
Be careful out there!
Full disclosure: long SDS; long VXX put, long CAT shares and puts, long SSO calls
- English (UK)
- English (India)
- English (Canada)
- English (Australia)
- English (South Africa)
- English (Philippines)
- English (Nigeria)
- Deutsch
- Español (España)
- Español (México)
- Français
- Italiano
- Nederlands
- Português (Portugal)
- Polski
- Português (Brasil)
- Русский
- Türkçe
- العربية
- Ελληνικά
- Svenska
- Suomi
- עברית
- 日本語
- 한국어
- 简体中文
- 繁體中文
- Bahasa Indonesia
- Bahasa Melayu
- ไทย
- Tiếng Việt
- हिंदी
Market Still Clinging To The Edge
Published 05/13/2012, 03:28 AM
Updated 07/09/2023, 06:31 AM
Market Still Clinging To The Edge
T2108 Status
Latest comments
Loading next article…
Install Our App
Risk Disclosure: Trading in financial instruments and/or cryptocurrencies involves high risks including the risk of losing some, or all, of your investment amount, and may not be suitable for all investors. Prices of cryptocurrencies are extremely volatile and may be affected by external factors such as financial, regulatory or political events. Trading on margin increases the financial risks.
Before deciding to trade in financial instrument or cryptocurrencies you should be fully informed of the risks and costs associated with trading the financial markets, carefully consider your investment objectives, level of experience, and risk appetite, and seek professional advice where needed.
Fusion Media would like to remind you that the data contained in this website is not necessarily real-time nor accurate. The data and prices on the website are not necessarily provided by any market or exchange, but may be provided by market makers, and so prices may not be accurate and may differ from the actual price at any given market, meaning prices are indicative and not appropriate for trading purposes. Fusion Media and any provider of the data contained in this website will not accept liability for any loss or damage as a result of your trading, or your reliance on the information contained within this website.
It is prohibited to use, store, reproduce, display, modify, transmit or distribute the data contained in this website without the explicit prior written permission of Fusion Media and/or the data provider. All intellectual property rights are reserved by the providers and/or the exchange providing the data contained in this website.
Fusion Media may be compensated by the advertisers that appear on the website, based on your interaction with the advertisements or advertisers.
© 2007-2024 - Fusion Media Limited. All Rights Reserved.
