• Conditions in the 2000s were highly conducive to keeping inflation in Canada in check. Over this period, strong service inflation was offset by very weak goods inflation. The massive influx of cheap Asian imports and the loonie’s sharp ascent contributed to curb the progression of the Canadian consumer
basket. What’s more, the federal government did its bit as well by cutting its sales tax twice from 2006 to 2008.
• To our eyes, however, things have now changed. China is gaining market shares at a much more moderate pace and we expect the currency to remain relatively stable over the next two years. The fact that the goods component in core inflation is presently rising at its highest rate since 2001 is probably a sign that the situation in Canada has already shifted.
• Furthermore, given the situation in the labour market, there is no deceleration in sight on the services side.
• The strain on the public finances of governments, also, is likely to translate into added lift for the Canadian consumer basket, particularly through higher sales taxes, property taxes and electricity rates.
• Our current baseline scenario, which incorporates a drop in oil prices and, in turn, in fuel costs, is pegging inflation at 2.2% in 2012. If fuel costs do not fall as much expected, it would come as no surprise to see inflation in Canada levitate to the upper fringes of the Bank of Canada’s target range. Our outlook contrasts with that of the central bank, which in its latest Monetary Policy Report predicted inflation to come in at 1.4% in 2012.
Core inflation in Canada surprisingly buoyant
Core CPI, the Bank of Canada’s benchmark index, has been registering strong inflation pressures of late. More precisely, the core index has risen at an annualized rate of 3.6% over the past four months, its fastest pace since 2002. To be sure, the price of automobiles and electricity explain in part the index’s recent progression. However, the fact remains that the sources of inflation in the Canadian consumer basket are growing. Is this merely a transient phenomenon or is something really changing? In this issue of the Weekly Economic Letter, we will brush a portrait of the current situation by bringing to light the differences between the present context and conditions prevailing in the 2000s. To this end, we have reconstructed a series of components that are not documented directly by Statistics Canada.
Source of frustration for economic analysts
Tracking inflation in Canada can be very frustrating for economic analysts. For example, the specificity of the Bank of Canada’s key index represents a pitfall for analysts. In the United States, it is easy to compute both the all-items CPI and the core CPI based on a small number of data series all seasonally adjusted, which greatly simplifies the matter of forecasting. In Canada, instead, this same task requires manipulating a large number of components given that, for its core index, the Bank of Canada prefers removing not food and energy as a whole but only the 8 most volatile sub-components of these. Under the circumstances, an economist might be tempted to cut corners by adopting more of a macroeconomic approach (i.e., based on the Phillips curve) than a microeconomic one (i.e., component by component) for his analysis. He might even be tempted simply to use the Bank of Canada’s target as a forecast given that core inflation has been holding within a narrow corridor close to this mark, particularly since 2004.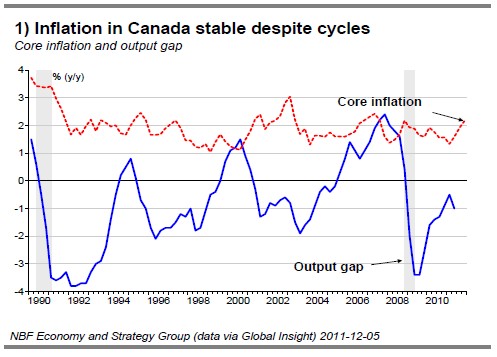
As for us, we have used a component-by-component method for the longest time. However, for the purposes of this Weekly Economic Letter, we will push our analysis further by using 77 components of the CPI. This will allow us to segment inflation in Canada in a different way. Such an exercise will permit us in particular to distinguish between goods and services for the components comprised in core inflation, which are data not provided directly by Statistics Canada. Unfortunately, the aggregate of these segments yields the core inflation which excludes the 8 most volatile components but still includes indirect taxes (CPIEX8) this in contrast with core inflation, which leaves out the effects of indirect taxes. However, as only 0.10 of a percentage point presently separates the two measures, the CPIEX8 will do nicely as a proxy for core inflation in Canada.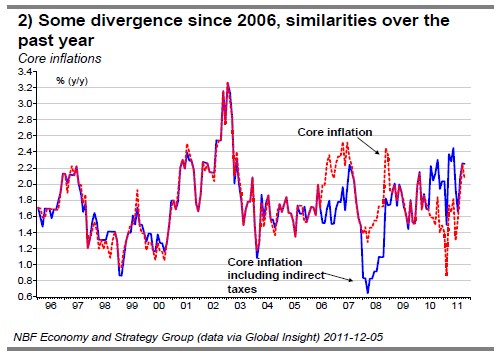
Breaking inflation down into components
Though core inflation in Canada has been stable at about 2%, the services and goods components have followed dynamics of their own. Since 2000, service inflation has progressed at an average annual rate of 2.8% while goods inflation has advanced at a more modest 0.5%.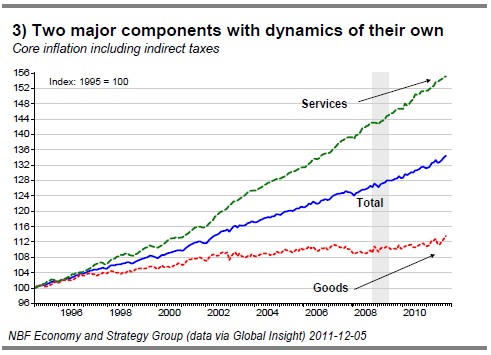
However, prices of goods in Canada are currently rising at the much faster pace of 1.8%, a record high since 2001 (Chart 4). Luckily, service inflation is presently at the lower end of its historical range, thus maintaining the CPIEX8 at 2.2%, which is just above the midpoint of the Bank of Canada’s target range.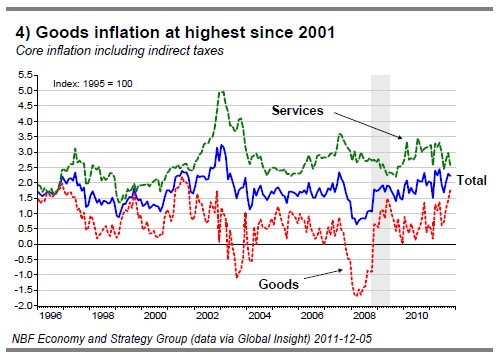
This significant increase in the price of goods is all the more surprising in that it cannot be explained by changes in any one single component. Indeed, all of the goods components are presently growing at rates above their average since 2000 (Chart 5). Of special note, growth has been particularly high in core food inflation (+4.6%) and in other non-durables (+2.7%).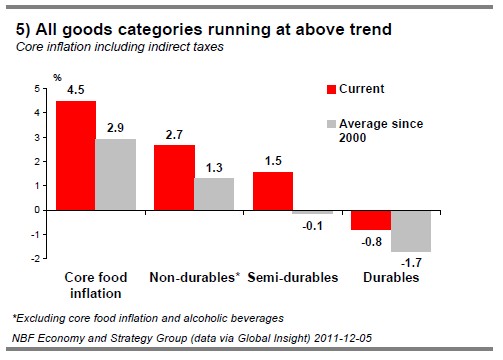
Two factors in particular explain the weak goods inflation in Canada in the past decade. First, China’s admission to the World Trade Organization unleashed a flood of cheap imports on the country from 2002 to 2006. In fact, as China gained market share in Canada, the economy experienced a period of temporary deflation which is set to abate as gains from the rising power grow at a slower pace. To our eyes, thing are much different today than during the period spanning 2002 to 2006, as Chinese imports are now growing at a much more subdued pace (Chart 6). Second, the loonie’s sharp ascent contributed to the decline in import prices in the previous cycle. Under current conditions, import prices should not benefit from any currency appreciation given that the exchange rate is expected to register only moderate fluctuations going forward.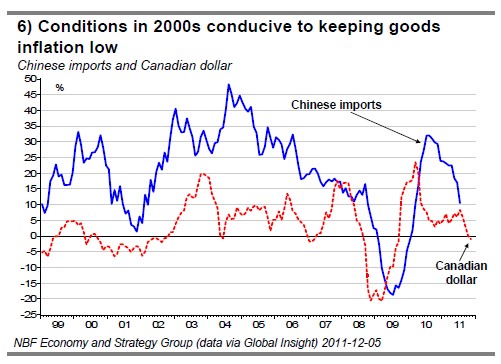
Consequently, goods should exert greater inflation pressures going forward than they did in the past decade. That said, it would be wrong to think that the strong advance in wages in Asia will translate into sharply higher import prices in the coming years. Despite the hefty wage growth in the Chinese manufacturing sector (127% from 2003 to 2008), wages only account for a wee portion of production costs. In this regard, the New York Federal Reserve has shown that employee wages for a boots manufacturer in China represented no more than 8% of the value of the exported goods. By comparison, in the United States, labour has historically represented about 2/3 of the total cost of production in the manufacturing sector.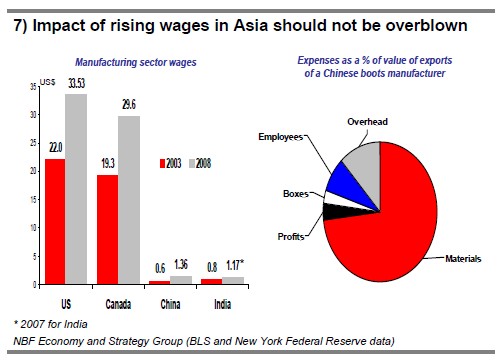
Mounting pressure from food
As mentioned, core food inflation in Canada has risen in the past year owing to a surge in the price of food commodities around the world since 2010. However, as the grains price index has declined slightly in the past few months, we can expect this component to progress at a more moderate pace in the short term. Still, the fact remains that, in the medium term, strong global demand for food products will continue to push core inflation up in Canada via this component.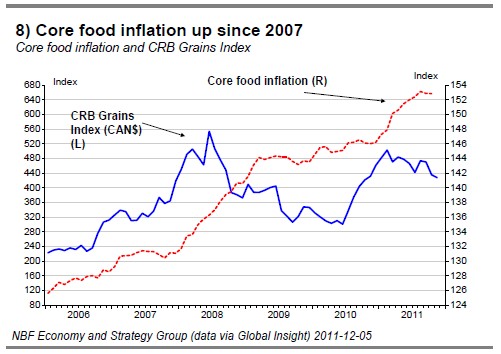
Services: no deceleration in sight
As mentioned, core service inflation is presently in the nether parts of its historical range (Chart 4). Let us begin here with two shelter-related components, namely, cost of rent and homeowner’s replacement cost. Whereas the former has registered very stable growth, the latter should continue to moderate as we anticipate a slowdown in housing. However, this component accounts for only 4.1% of all-items inflation in Canada.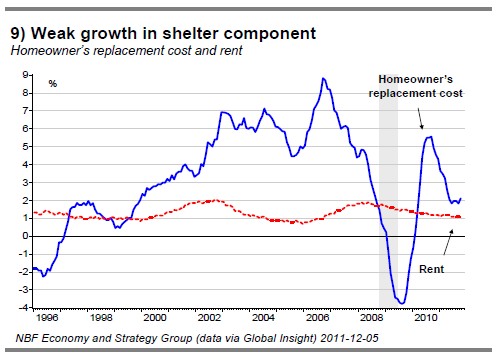
The other services included in core inflation, which represent 31.2% of all-items inflation, are progressing at the rate of 2.8% right now. This growth could even pick up in the coming months. Indeed, given that the unemployment rate in this sector is well-nigh at its all-time low, it is unlikely that service inflation will stay much longer below its average level since 2007 (3.2%). It should be noted that as unemployment dropped gradually in the previous cycle, service prices accelerated steadily, if we exclude the sharp increase in 2002-2003 attributable solely to a strong advance in insurance prices. In this regard, there is no ruling out seeing steep increases once again in this sector given that the insurance industry needs to re-establish its profitability, which has been severely shaken by the drop in long-term interest rates and weak stock market returns.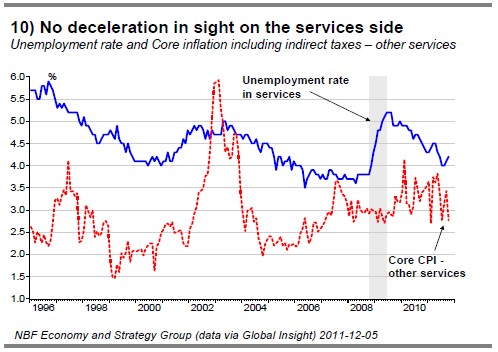
But what of all-items inflation?
The overall picture today suggests that core inflation in Canada is likely to experience much stronger pressures in the next two years than it has in the past. But what of allitems inflation? Of course, the key variable in this case remains the price of energy, particularly gasoline, on account of its weight and high volatility. To our eyes, the price of gasoline in Canada should fall in the months to come. In our view, oil prices should correct by $10 a barrel
relative to current levels, in order to be more in sync with how the world economy is progressing. If our forecast comes true, inflation should stand at 2.2% over the next year. However, if gasoline prices surprise on the upside, we cannot dismiss the possibility of seeing inflation in the upper reaches of the Bank of Canada’s target range.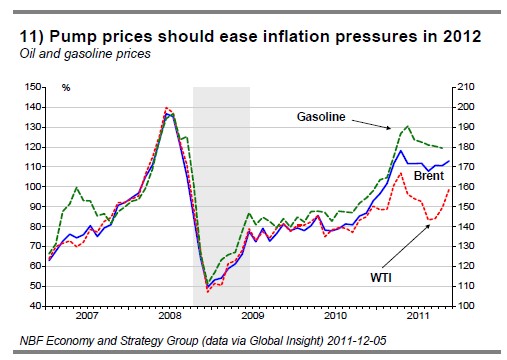
Moreover, as it happens, the all-items CPI also takes indirect taxes into consideration. Seeing how numerous governments will need to reduce their deficits in the coming years, inflation in Canada could be upwardly affected as a result. Such a situation would contrast with the one that prevailed in 2006–2008, when the Canadian consumer basket benefited from two cuts in the sales tax by the federal government. In this regard, Quebec has already announced it will raise its sales tax effective this January; other governments could follow suit. Governments could also choose to go a different route, that is, jack up electricity rates, which would also be reflected in inflation. Finally, let us not forget that municipal governments, too, could continue to drive
inflation upward. Indeed, property taxes in Canada have grown 3.5% on average since 2007.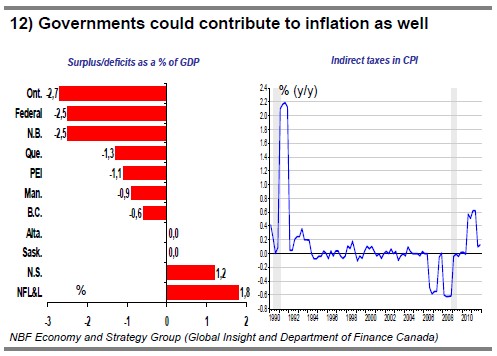
Conclusion
Conditions in the 2000s were highly conducive to keeping inflation in Canada in check. Over this period, strong service inflation was offset by very weak goods inflation. The massive influx of cheap Asian imports and the loonie’s sharp ascent contributed to curb the progression of the Canadian consumer basket. What’s more, the federal government did its bit as well by cutting its sales tax twice from 2006 to 2008. To our eyes, however, things have now changed. China is gaining market shares at a much more moderate pace and we expect the currency to remain relatively stable over the next two years. The fact that the goods component in core inflation is presently rising at its highest rate since 2001 is probably a sign that the situation in Canada has already shifted. Furthermore, given the situation in the labour market, there is no deceleration in sight on the services side. The strain on the public finances of governments, also, is likely to translate into added lift for the Canadian consumer basket, particularly through higher sales taxes, property taxes and electricity rates. Our current baseline scenario, which incorporates a drop in oil prices and, in turn, in fuel costs, is pegging inflation at 2.2% in 2012. If fuel costs do not fall as much as expected, it would come as no surprise to see inflation in Canada levitate to the upper fringes of the Bank of Canada’s target range. Our outlook contrasts with that of the central bank, which in its latest Monetary Policy Report predicted inflation to come in at 1.4% in 2012.
ECONOMIC INDICATORS REVIEW
Canada – In November, total employment declined again (-18.6K) following a marked deterioration in October (-54.0K). Losses were observed in part-time jobs (-53.3K) while full-time jobs registered an advance (+34.6K). The goods-producing sector added 25.2K jobs after shedding 51.9K the previous month. Within this sector, construction (+19.6K) and natural resources (+9.9K) were the top contributors. The service-producing sector posted a steep drop of 43.9K, with losses occurring mostly in trade (-34.1K) and business, building and other support services (-29.2K). Six of the provinces were in the red on the month with Quebec (-30.5K) turning in the worst showing by far. The unemployment rate notched up to 7.4% from 7.3% the month before. Generally speaking, the labour situation in Canada has darkened in recent months.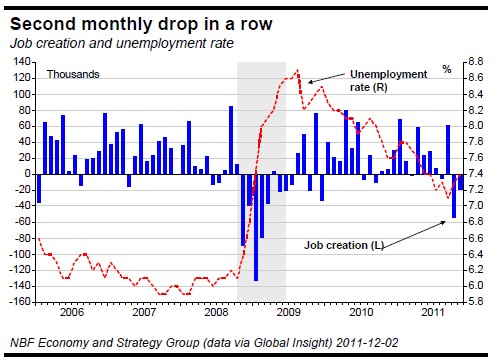
Total employment has now fallen three times in the past four months. For the manufacturing sector, November marked a third straight drop in this regard. The month’s report reflected a definitely lacklustre performance, all the more so that it came on the heels of a 54K loss in October. Luckily, the 34K gain in full-time jobs brightened matters somewhat; this made for a cumulative gain in this segment of 26K over the past three months. The pick up in full-time employment more than offset the negative impact of the losses in part-time jobs and thus boosted total hours worked on the month by 0.3%. However, so far in the quarter, total hours worked remained negative (-0.8%), which is consistent with the moderation in GDP in Q4.
In 2011Q3, Canadian GDP bounced back sharply, growing a consensus-topping 3.5% annualized after contracting slightly in Q2. The first and second quarters were each revised downward a tick. Having largely overcome supplychain problems (a major factor in Q2), trade turned abruptly from drag to thrust in Q3. Exports sprang an annualized 14.4%, the largest quarterly gain since 2004Q2. Domestic demand moderated a bit after a strong Q2, rising only 0.9% annualized. The slowdown was due to a 3.6% annualized drop in business fixed investment after a hot Q2. Helping support domestic demand, however, was consumption spending, which progressed 1.2% annualized despite a drop in disposable income on the quarter. Residential construction grew 10.9% annualized, its best quarterly performance since 2010Q1. Inventories, for their part, detracted from GDP.
United States – In November, U.S. non-farm payrolls showed a 120K increase, just shy of the 125K expected by consensus. In addition, the numbers for the previous two months were revised up a cumulative 72K. The private sector added 140K jobs, with gains coming mostly in service sectors. Government continued to shed jobs, particularly at the state and municipal levels. Average hourly earnings sagged 0.1%, while hours worked per week were flat at 34.3. Aggregate hours worked, however, edged up 0.1%. The Household Survey showed 278K new jobs were created after 277K were added the preceding month. These job gains, combined with a two-tick drop in the participation rate to 64%, lowered the unemployment rate four ticks to 8.6%. The upward revisions made this report better than expected. Thanks to the increase in aggregate hours worked, Q4 is now on track for a 1.6% annualized gain, which marks an acceleration from Q3 when hours held steady essentially.
Again in November, the ISM Manufacturing Index climbed 1.9 points to 52.7. Both the production and new orders components showed solid gains on the month, suggesting the manufacturing sector is building up momentum in Q4. The production index jumped 6.5 points to 56.6 and new orders rose 4.3 points to 56.7. In both cases, these were the highest readings in 7 months.
Still in November, the Conference Board Consumer Confidence Index vaulted 15.1 points to 56. Americans were more optimistic than a month earlier about the future, as this component of the survey flew 17.8 points higher to 60.8. On the employment front, the percentage of respondents who reported jobs were hard to find slipped 4.8 points to 42.1%, its lowest mark since January 2009.
In October, construction spending was up for a third consecutive month, rising 0.8% to $798.5 billion. New-home sales picked up the pace 1.3% to 307000 units. This compares well against the 12-month moving average of 303000 units. September’s figure was revised down 10000 to 303000 units.
Finally, seasonally adjusted annualized sales of cars and light trucks totalled 13.59 million in November, up 2.9% month over month and 11.1% year over year.
- English (UK)
- English (India)
- English (Canada)
- English (Australia)
- English (South Africa)
- English (Philippines)
- English (Nigeria)
- Deutsch
- Español (España)
- Español (México)
- Français
- Italiano
- Nederlands
- Português (Portugal)
- Polski
- Português (Brasil)
- Русский
- Türkçe
- العربية
- Ελληνικά
- Svenska
- Suomi
- עברית
- 日本語
- 한국어
- 简体中文
- 繁體中文
- Bahasa Indonesia
- Bahasa Melayu
- ไทย
- Tiếng Việt
- हिंदी
Looking at Inflation in Canada From a Different Angle and U.S. Performance
Published 12/06/2011, 09:03 AM
Updated 05/14/2017, 06:45 AM
Looking at Inflation in Canada From a Different Angle and U.S. Performance
Summary
Latest comments
Loading next article…
Install Our App
Risk Disclosure: Trading in financial instruments and/or cryptocurrencies involves high risks including the risk of losing some, or all, of your investment amount, and may not be suitable for all investors. Prices of cryptocurrencies are extremely volatile and may be affected by external factors such as financial, regulatory or political events. Trading on margin increases the financial risks.
Before deciding to trade in financial instrument or cryptocurrencies you should be fully informed of the risks and costs associated with trading the financial markets, carefully consider your investment objectives, level of experience, and risk appetite, and seek professional advice where needed.
Fusion Media would like to remind you that the data contained in this website is not necessarily real-time nor accurate. The data and prices on the website are not necessarily provided by any market or exchange, but may be provided by market makers, and so prices may not be accurate and may differ from the actual price at any given market, meaning prices are indicative and not appropriate for trading purposes. Fusion Media and any provider of the data contained in this website will not accept liability for any loss or damage as a result of your trading, or your reliance on the information contained within this website.
It is prohibited to use, store, reproduce, display, modify, transmit or distribute the data contained in this website without the explicit prior written permission of Fusion Media and/or the data provider. All intellectual property rights are reserved by the providers and/or the exchange providing the data contained in this website.
Fusion Media may be compensated by the advertisers that appear on the website, based on your interaction with the advertisements or advertisers.
© 2007-2024 - Fusion Media Limited. All Rights Reserved.
